The benefits of being focused as a long-term investor
When learning to drive, novice drivers often find it difficult to keep the car going in a straight line. Why? They focus on the road right in front of the car and over correct for small perceived misdirection. The solution? Focus on the road further into the distance…
When volatility rears its head in the market and investors become nervous, one cannot help but wonder if it might be better to exit the market and wait for things to settle down before participating again.
This month, we investigated whether there is any benefit to selling out and sitting on the side-lines when markets take a turn for the worse.
Behavioural biases
As humans we are all predisposed to certain flaws in our decision making processes which may lead to decisions that are harmful to our investment portfolios and the probability of achieving our investment goals. We have assessed historical data and found that giving in to these, oftentimes impulsive, decisions can counterintuitively lead to capital destruction.
Two of the more prevalent behavioural flaws in this regard include risk aversion and anchoring:
Risk aversion
The tendency to prefer certainty over uncertainty, even if the expected gain from the uncertain outcome is equal to or even higher than the value of the more certain outcome.
Faced with the choice of
- receiving a fixed amount of R100, or
- playing a game of 10 rounds where you can either lose R1,000 or win R1,000 but you will win 60% of the time resulting in an expected gain of R200.
People tend to choose the first option.
This bias is seen during times of market downturns, when investors prefer to “park” funds in safe money market accounts as opposed to remaining invested in the market where the potential for superior long-term returns are better.
Anchoring
The tendency for one’s decisions to be influenced by a particular reference point or ‘anchor’. When markets are declining and it comes to measuring our portfolio performance, we tend to use the previous market high as our reference point. Panic is usually correlated to the magnitude of the decline from the previous market high.
“Everyone is a long-term investor until the market goes down” – Peter Lynch
Although we know that past market performance is not necessarily indicative of future performance, we analysed the FTSE/JSE All Share and MSCI World Indices’ historical returns over a 52 year period, in order to ascertain whether investor behaviour added value during historical periods of market weakness.
The chart below shows historical drawdowns in relation to the respective highs of these indices. In other words, the below shows the percentage decline from the previous high until such time as a new high is reached. For example, referring to the Financial Crises of 2009, the MSCI World Index fell approximately 40% from its previous high, which was only reached again during 2012.
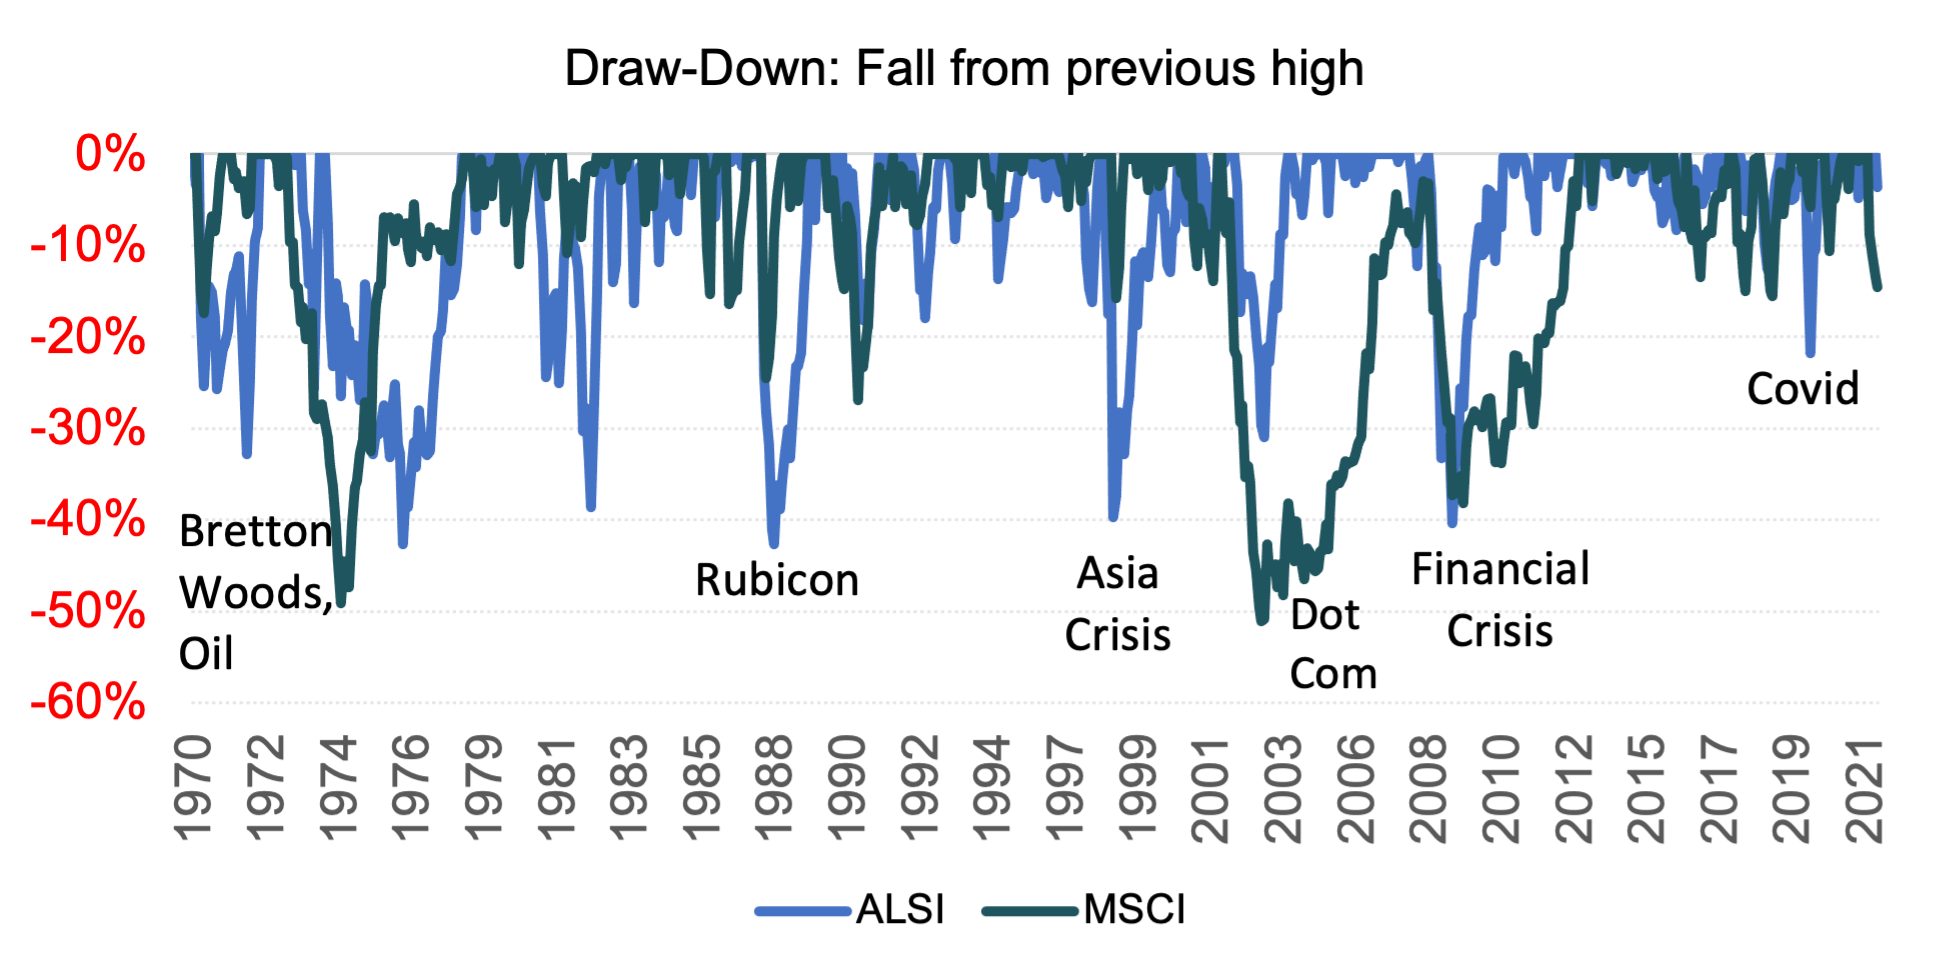
Clearly, in the short-term, markets can cause even the most seasoned investor to second guess themselves and consider uncharacteristic impulsive decisions; many will question if it is possible to prevent the impact of these extreme negative movements on their investments.
You might feel that by simply selling when the market has fallen by a certain amount and parking your funds in cash you are better off, but history has shown us this is not the case as is evident in the scenarios below.
Does selling when the market is falling assist in protecting capital?
Let’s investigate what the market did after different levels of pull-backs. First, we identified instances where the market fell by 20% from the previous high. We then repeated this exercise for various levels of pull-backs.
The performance of the market after this event, over a 1-, 3-, 6- and 12-month periods was then tracked.
We ignored the question of when to re-enter the market, transaction costs and tax.
The graph below indicates the points where the market fell by 20% from the previous high, marked in red for the ALSI and green for the MSCI.
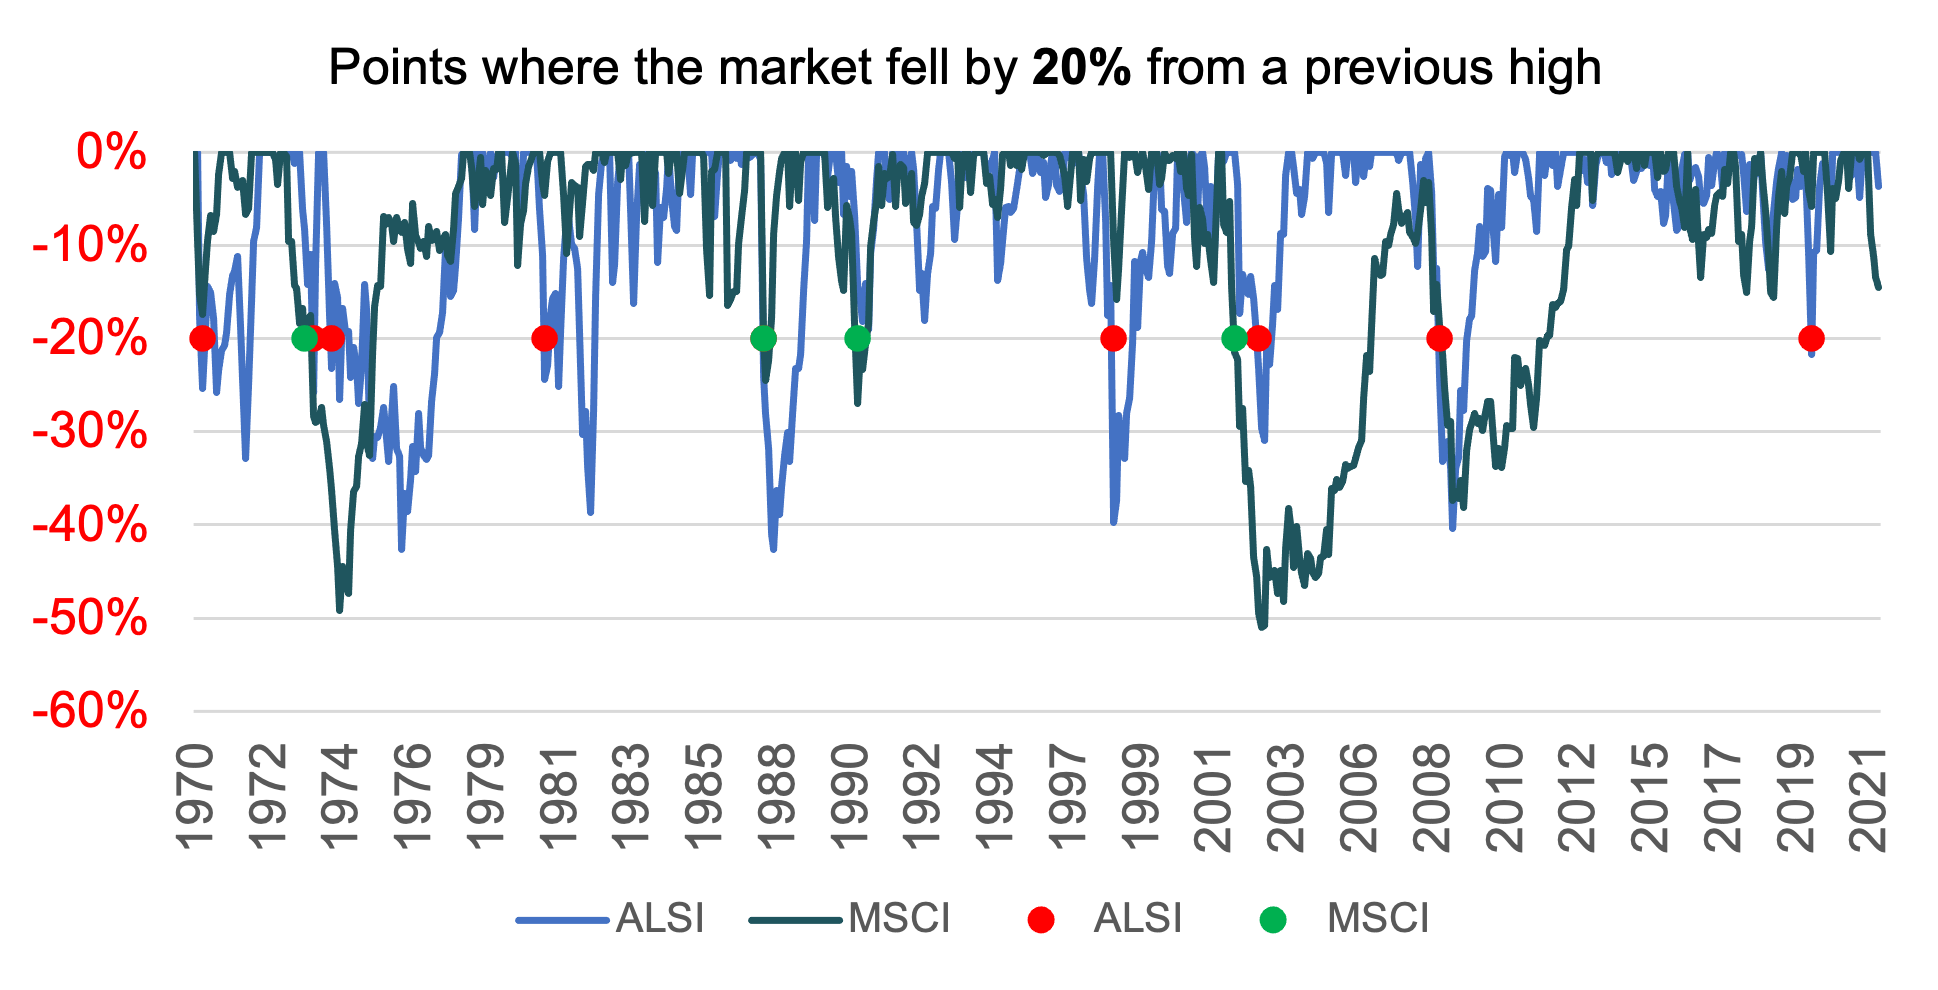
The table below outlines the results of this exercise over the various pullbacks. It is important to note that these events occurred at different points in time for the respective markets.

Looking at the results in the table, one can see that withdrawing money from the market post a pull-back would probably destroy value as, in most cases, you would not have benefited from the market recovery that typically followed and you would have locked in your losses by withdrawing. In most cases, the one-year return after the pull-back was also in excess of the return that you would have earned while “hiding” in cash.
The result might feel counter-intuitive. The problem is that there is no pattern in extreme market moves. The market does not typically fall or rise when it is close to or far away from a previous high point. The unpredictability of the market makes it almost impossible to anticipate when extreme movements are going to occur
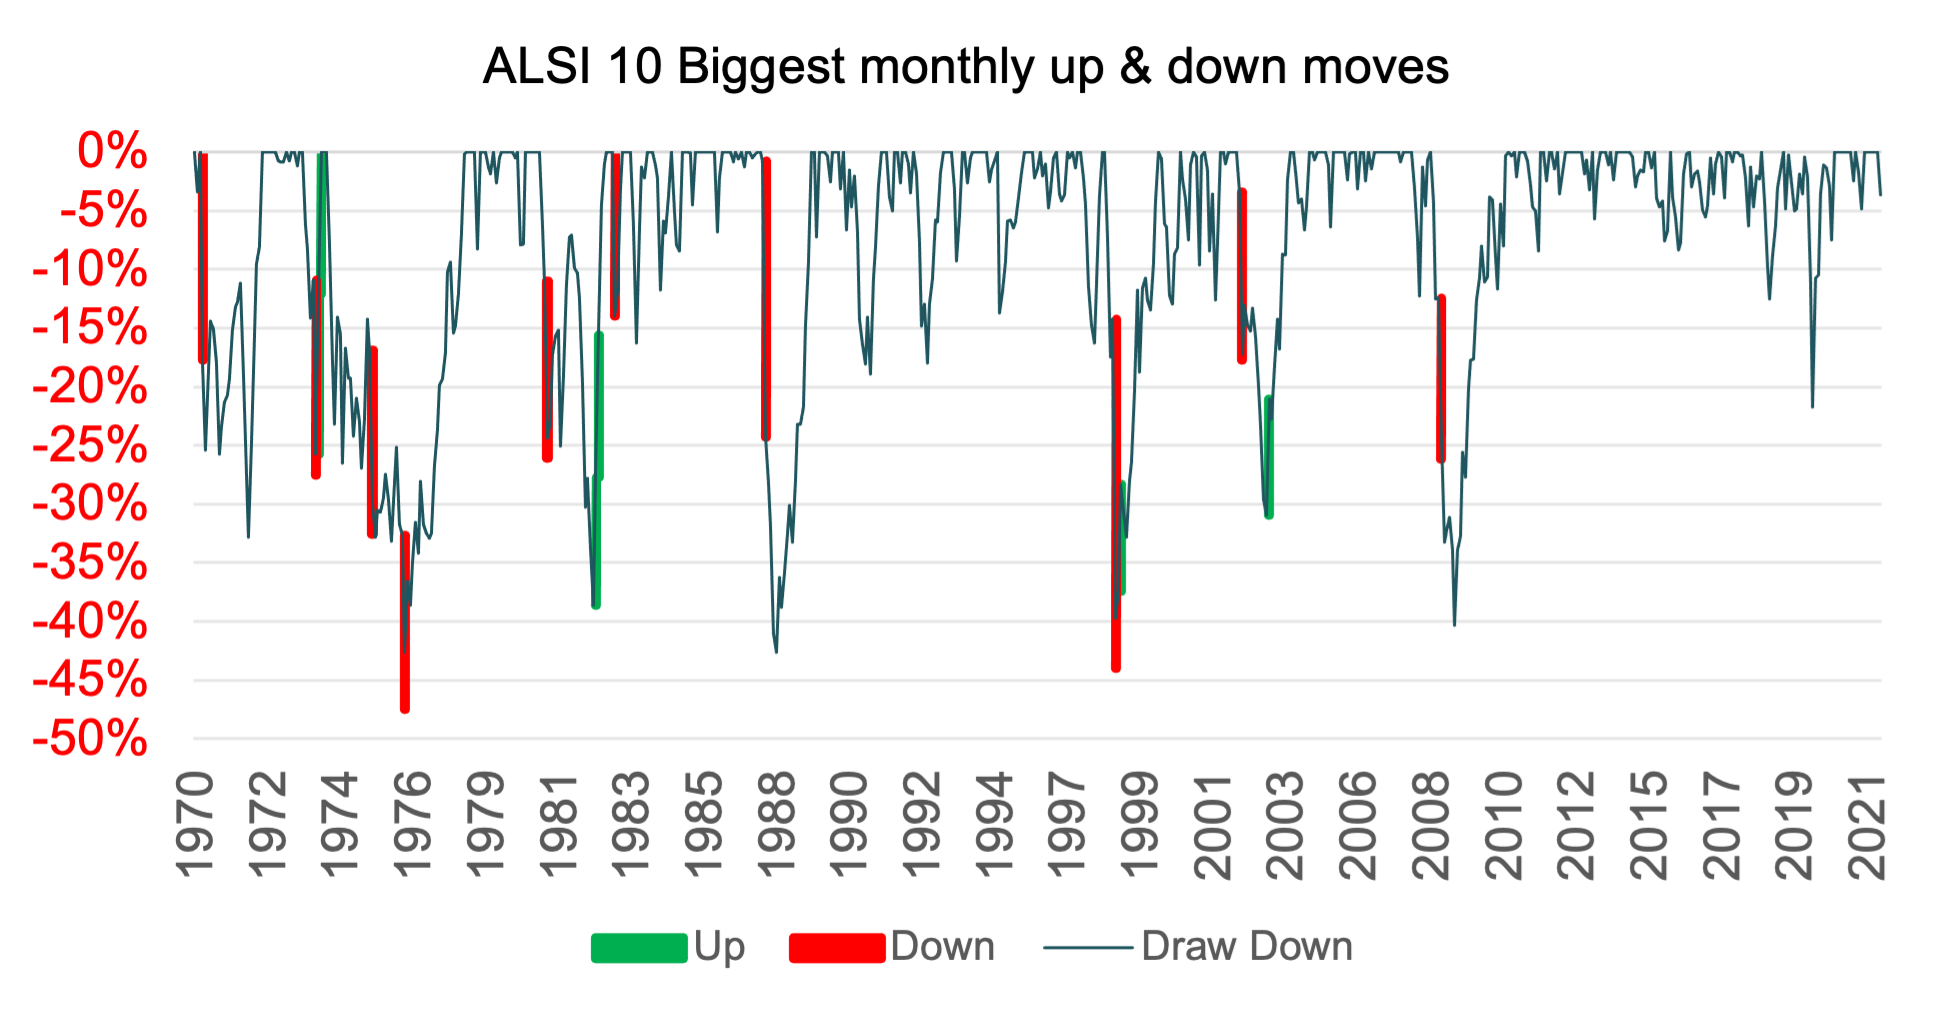
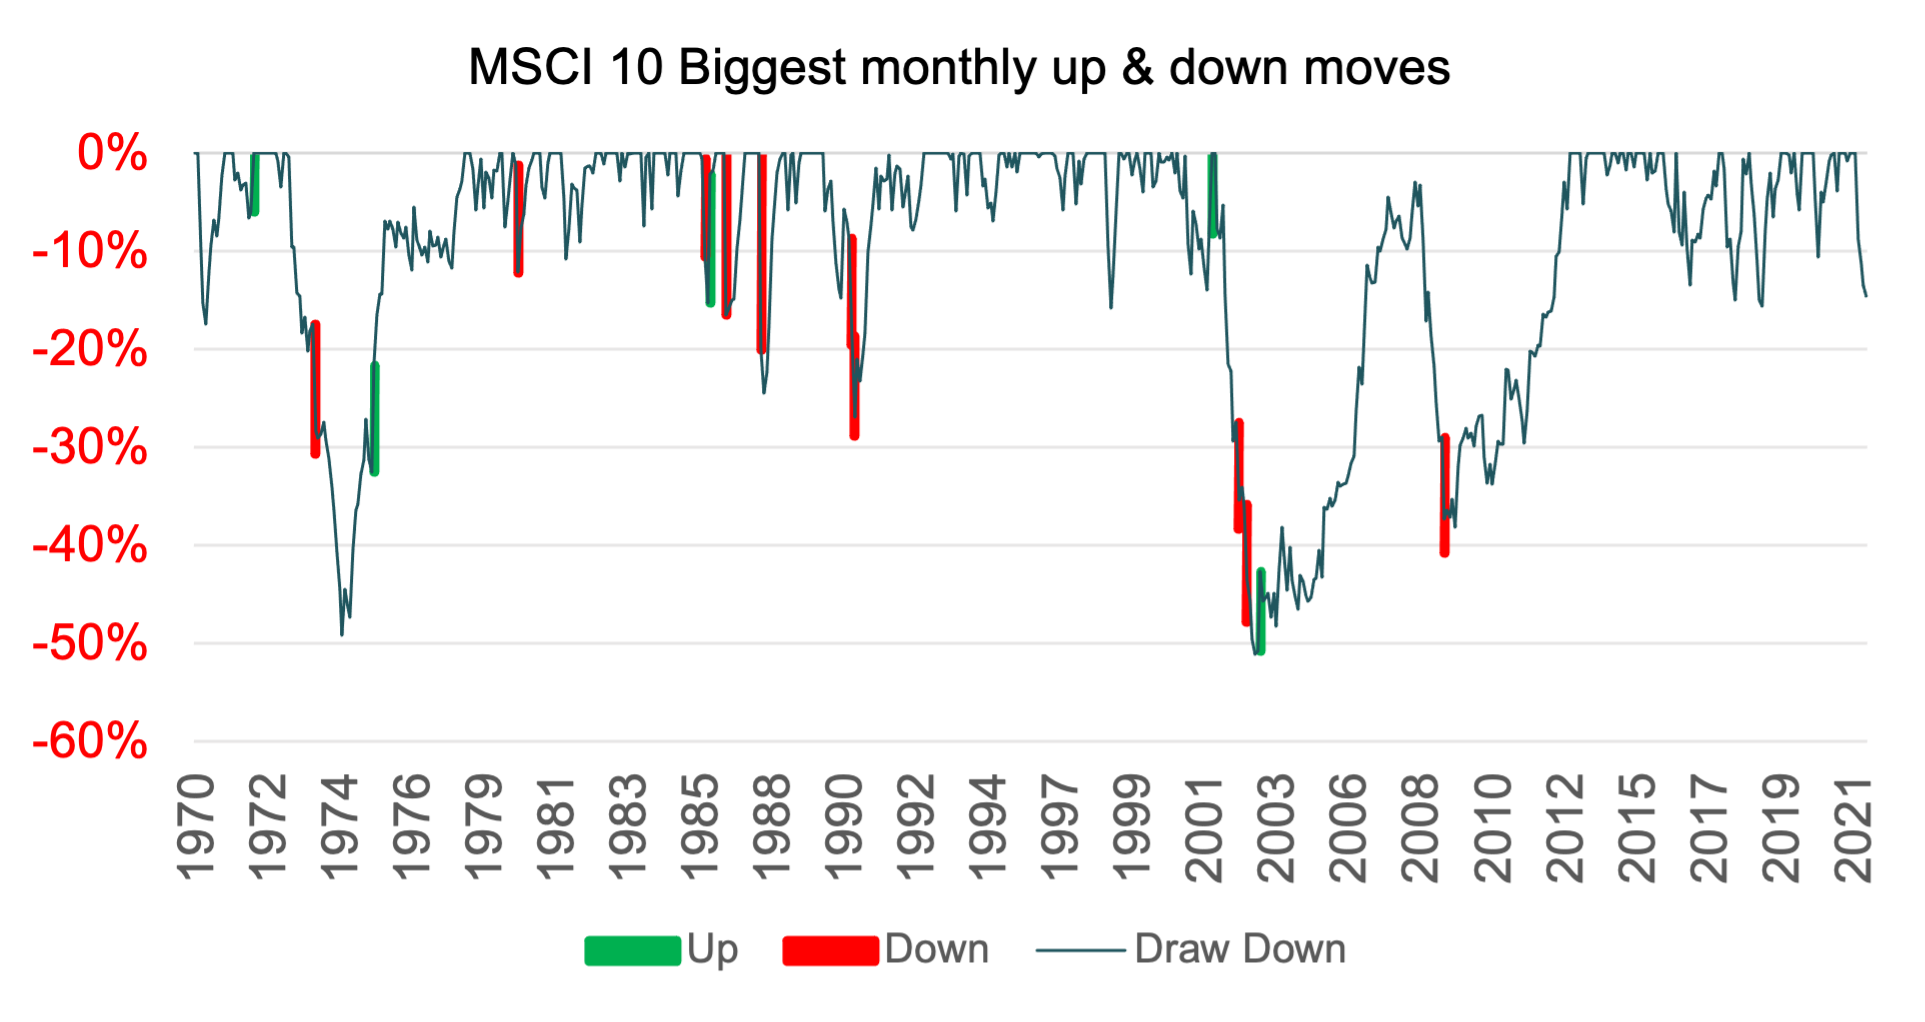
To illustrate this point, we show when the ten most extreme market moves, up or down, occurred relative to the previous high point in the graphs below. As you will notice, the green (positive) and red (negative) bars are scattered across various levels of drawdown and do not cluster around specific zones, ie: there is no pattern. Being at a high does not mean the market will soon fall, neither does being at an all time low indicate the market cannot fall further.
Know what to expect
Equity markets offer the potential to earn higher returns when compared to other asset classes. If you want to make use of this opportunity, you should know what to expect and use diversification where possible.
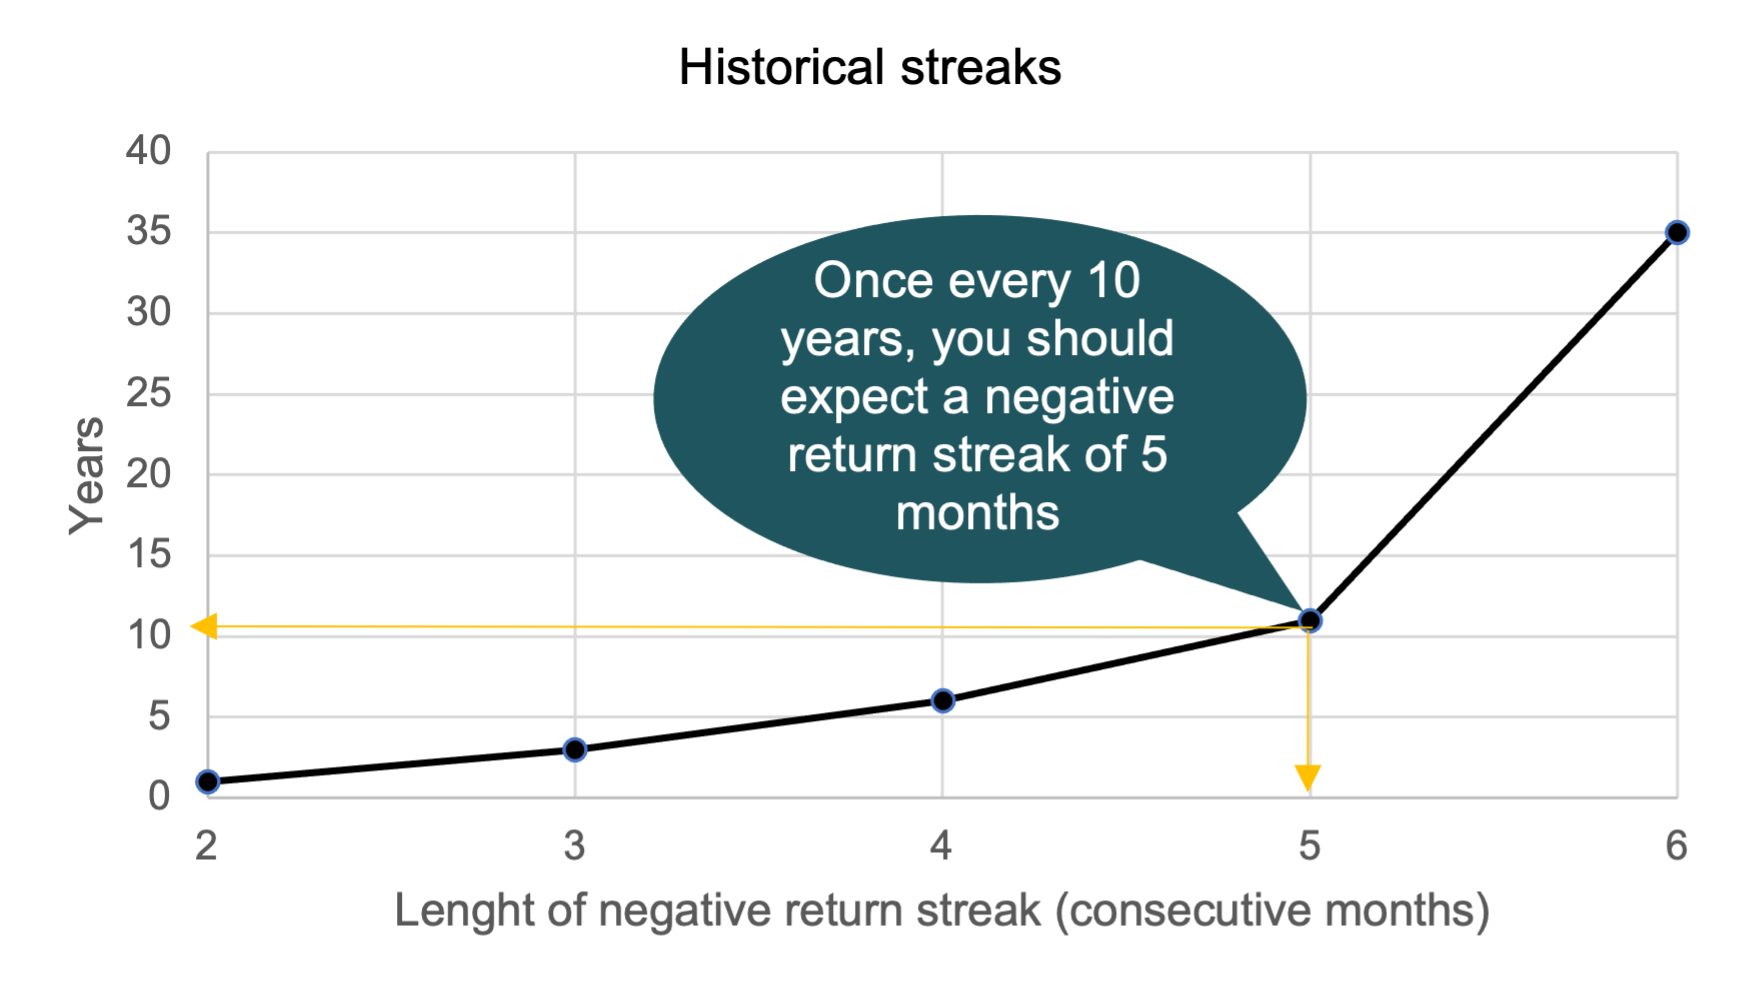
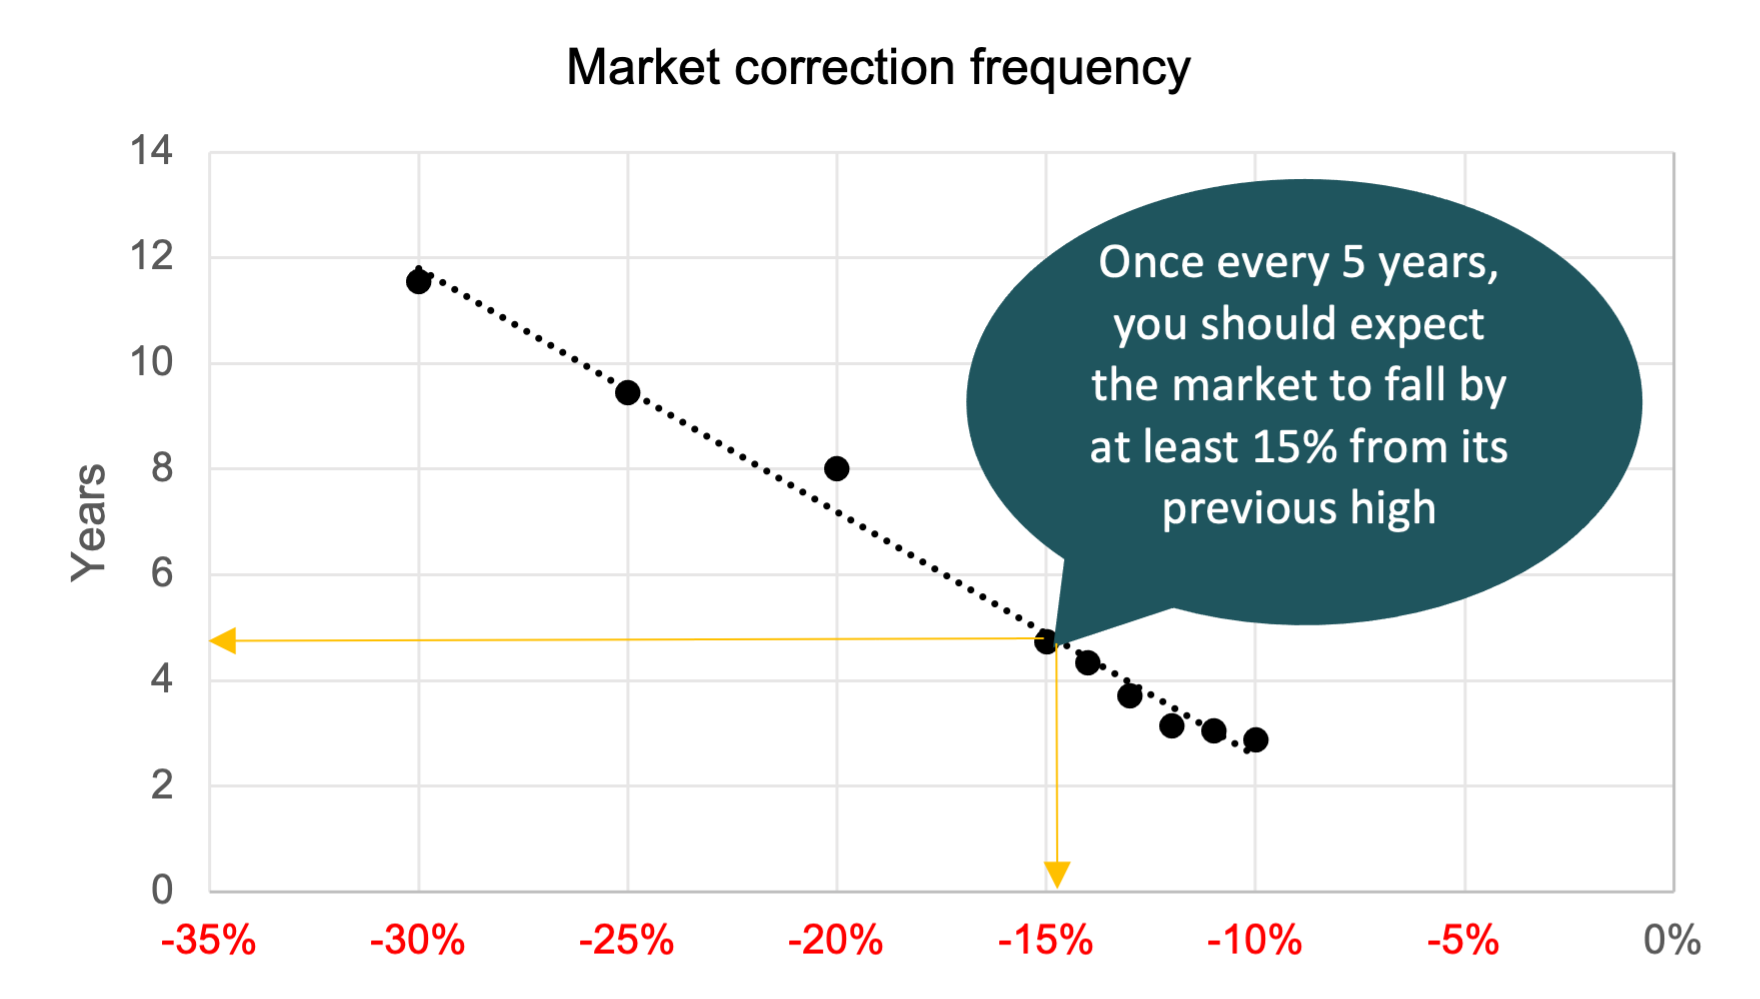
To set our expectations as long-term investors, we will again refer to history. We will look at the length of consecutive negative returns (Negative Streaks), the size and frequency of market corrections (Corrections) and finally the typical time it took the market to achieve a new high point (Time to achieve new high)
Negative Streaks – number of consecutive months with a negative return
Corrections – frequency and magnitude of negative returns
Time to achieve a new high: how long it took for the market to achieve a new high point

The benefits of diversification
Let’s see what happens when you combine the ALSI and MSCI in equal weights. The below graph compares the combined portfolio to the individual investments in the ALSI and MSCI. Clearly, the combined portfolio has less severe movements, showing the benefits of diversification. The combined portfolio exhibits less severe movements.
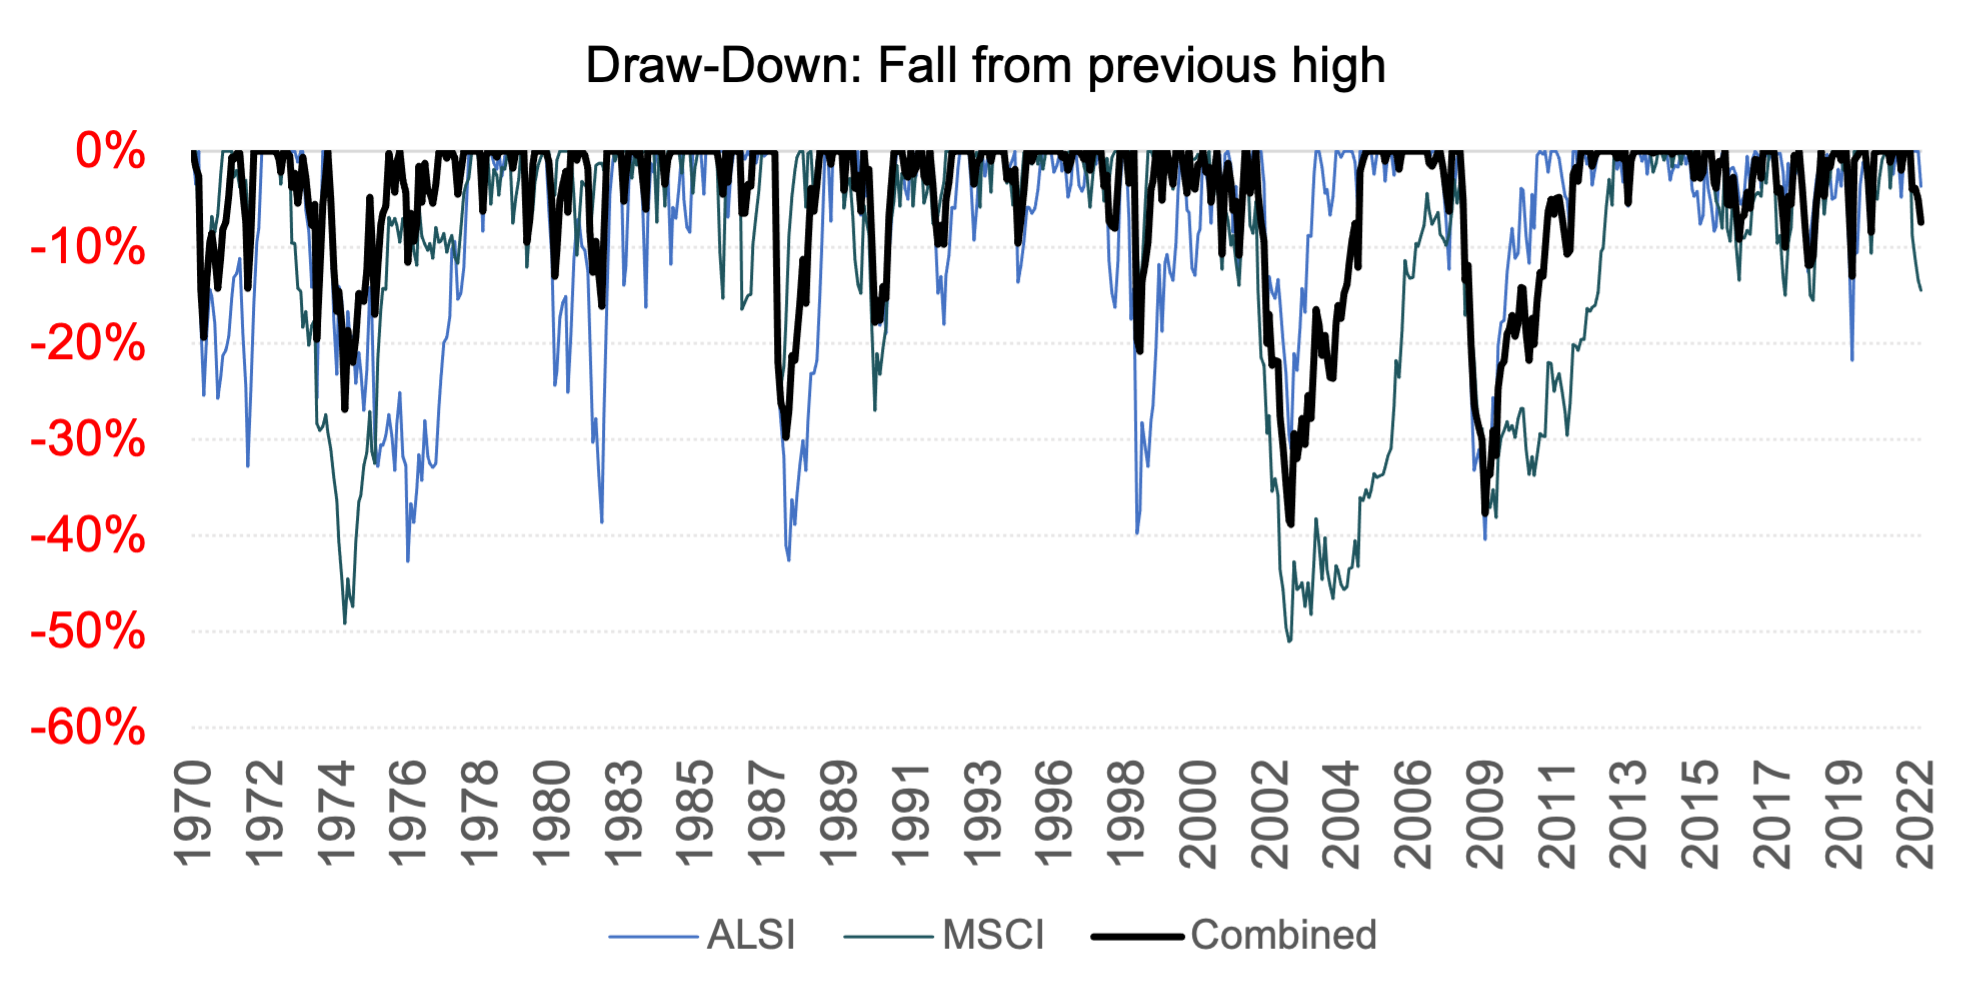
By combining the ALSI and MSCI, the draw-down profile improves substantially.

Diversification improves the risk profile of most investments, making it less prone to activate some behavioural biases, a “sleep well” portfolio.
Conclusion
The price that the market is willing to pay for future earnings often fluctuates wildly. The information in this document should prepare you to some extent on what to expect. In the long run, the market reflects the underlying earnings of the companies that make it up.
If your personal situation changes to such an extent that your risk profile and return objectives have changed, you should relook your portfolio allocations.
Unless your situation has changed, keep your eyes on the horizon and try to discount the short-term noise.
ABOUT THE AUTHOR:
Henk Myburgh, CFA®- Head of Research
After completing a BCom Econometrics and MSc in Quantitative Risk Management at the North-West University, Henk Myburgh (CFA), started his career in financial risk management at HSBC. He also worked at Sanlam Capital Markets, where his focus was on consolidation of financial risk across the firm and management of risk on a holistic basis. In 2018 he founded AlQuaTra, a quantitative private hedge fund.


