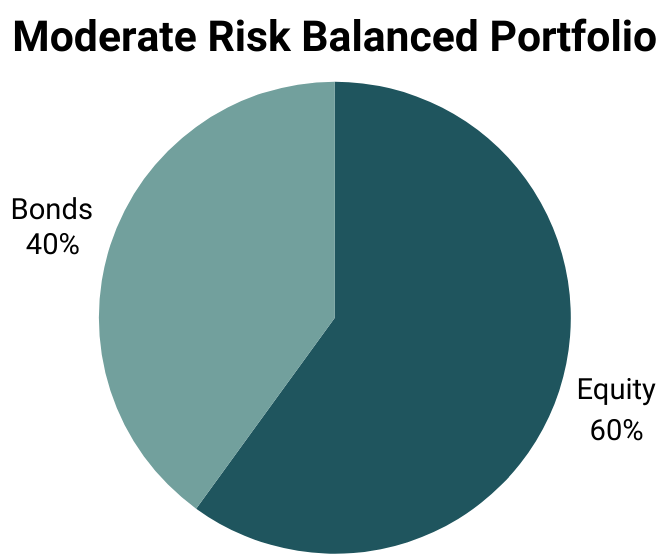
In this newsletter we look at the historical performance of bonds in a balanced portfolio and whether it is rational to allocate less to bonds than the traditional 40% for a balanced portfolio (60% equity).
Balanced portfolios are constantly scrutinized in terms of asset allocation. The market norm for a moderate risk, balanced portfolio, is a 60% equity and 40% bond asset allocation.
The rationale for this allocation is that the investor will participate asymmetrically in equity returns while portfolio volatility will be smoothed out due to the bond exposure. This smoothing comes at the cost of a lower return, hence the 40% limitation to minimize the impact.
In an effort to evaluate the validity of this asset allocation, we have taken a look at the historical performance of bonds and equities over the past 71 years, taking the relative price of these asset classes into account.
Bonds yields (By) reached historical lows in July 2020, ending a downward slope that started in 1980.
Figure 1

Bond price and yield are inversely related. Consequently, this reduction in yield led to a 42-year bull market in bond prices. It is important to note that if you buy and hold a bond until maturity, your annualized return will be equivalent to the yield that you bought the bond at.
For a long term buy and hold investor, the return from holding bonds deteriorated over the 42 year period ending July 2020.
On the other hand, equity prices are derived from future earnings discounted to a present value. The discount rate comprises of various factors. One prominent factor is interest rates. Again, this is an inverse relationship. As interest rates fall, the present value of future earnings increases, like the price of a bond. The reduction in bond yields has contributed significantly to the rise in the equity market.
Due to these relationships, we see the future earnings from companies decrease in value as bond yields increase, and vice versa.
As a result of the prolonged strength in the equity market, conventional balanced portfolio asset allocation started coming into question, with financial market participants arguing for less bond exposure (<40%).
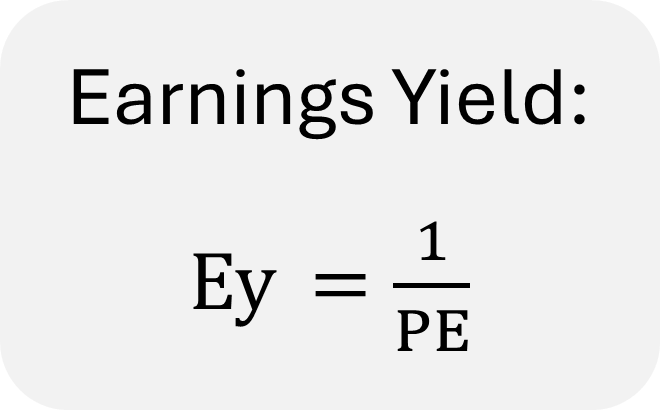
To compare the price of bonds with equities, we can use the yield of bonds and compare it to the equity earnings yield (Ey). The earnings yield of equity is derived from the Price / Earnings (PE) ratio.
The PE ratio of an equity can be interpreted in several ways:
- It is the amount paid for 1 unit of earnings;
- It is the number of years it will take to earn back the price you paid in earnings; and
- It is the earnings multiplier that converts earnings to price.
If you invert the PE ratio, the result is the earnings yield. This is similar to the bond yield, because this shows how much earnings you are expected to receive per unit of currency.
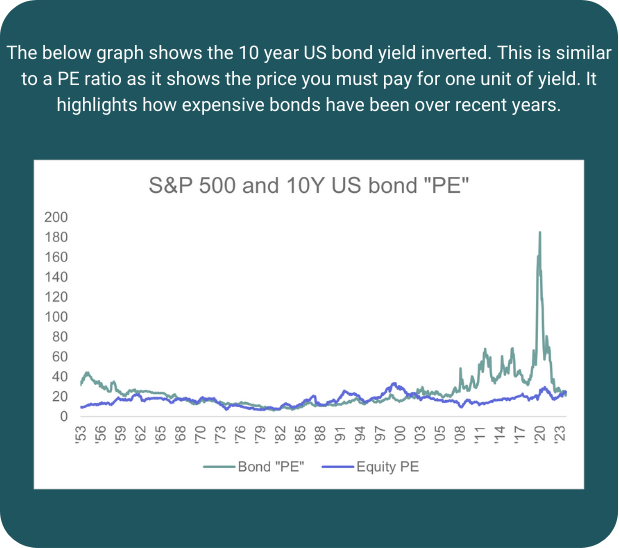
The below graph shows the S&P 500 earnings and 10-year US bond yield over the past 71 years.
Figure 2

The comparison highlights the available return from these asset classes over time. The lower the return, the higher the price and vice versa. When the Ey is greater than the By, bonds are relatively more expensive. When the Bond yield is greater than the Earnings yield, equities are relatively more expensive. Looking at the above graph, it is evident that bonds have been expensive on a relative basis over the past 20 years.
The below graph is derived from the previous one. It shows the difference between the 10 Year US bond and the S&P 500 earnings yield (By-Ey), since June 1953. The graph highlights the prolonged periods where either equities or bonds were relatively expensive.
Figure 3

The next two graphs show the 1-year return (1Y forward return) after each point on the graph above. The last 20 years (bond expensive) are shown in orange and the current difference is also shown in red for reference.
Figure 4

Figure 5

Historically, and intuitively, bonds performed better when they were relatively cheap compared to equity (By > Ey) and equity performed better when it was relatively cheap compared to bonds (By < Ey).
Finally, the graph below shows the result when equity and bonds are combined in a 60% equity and 40% bonds ratio – to form a traditional balanced portfolio.
Figure 6

Historically, the balanced portfolio performed, on average, the same, regardless of the relationship between bond and earnings yield. The results above show that, over the past 20 years, equity has been the dominant contributor to the balanced portfolio. This outperformance was driven by bonds being relatively expensive when compared to equity. During such times, it would make sense to have less exposure to bonds (<40%), in favour of equity.
Currently the 10Y US bond yield is marginally greater than the S&P 500 equity yield, indicating that the asset allocation in a balanced portfolio should be close to the traditional 60% equity, 40% bond split. One could even argue for a greater than 40% allocation to bonds.
To conclude, over the past 20 years, bonds were expensive leading to the relative outperformance of equity. The conventional balanced portfolio maintained similar performance regardless of the relative value between bonds and equity.
Our view is that the bond yield will remain higher for the foreseeable future, prompting us to stick to the traditional weights of a balanced portfolio (with limited tactical deviations).
View the June 2024 Market Summary
ViewABOUT THE AUTHOR:
Henk Myburgh, CFA®- Head of Research
After completing a BCom Econometrics and MSc in Quantitative Risk Management at the North-West University, Henk Myburgh (CFA), started his career in financial risk management at HSBC. He also worked at Sanlam Capital Markets, where his focus was on consolidation of financial risk across the firm and management of risk on a holistic basis. In 2018 he founded AlQuaTra, a quantitative private hedge fund.

