In the February newsletter, Goldilocks Economy or a Bad Moon Rising?, Benjamin van Wyk, CFA discussed the yield curve as a leading indicator of recession.

From an investor’s point of view, it is reasonable to argue that the health of the economy has a significant impact on businesses and subsequently on the value of these businesses. On the other hand, it is well documented that there can be prolonged periods of disconnect between the economy and the value of companies as determined by markets.
This raises the question: How do you gauge whether the economy will react to restrictive monetary policy and how will the market react, if at all?
Can the Federal Reserve System (FED) claim a “soft landing” yet?
Much has been written about a looming recession in the USA, with the FED’s narrative claiming a “soft landing” for the economy. These points of discussion are all in reference to high(er) interest rates driven by high(er) inflation.
As part of the fight against inflation, the FED implemented restrictive monetary policy, raising the FED funds rate (the rate at which banks borrow money overnight, also known as the “Policy Rate”) from 0.25% to 5.5% over 18 months, the most aggressive rate hike on record.

This increase in short term interest rates led to the inversion of the yield curve (short-term interest rates higher than long-term interest rates).

Historically, an inverted yield curve has been a successful leading indicator of recessions. As a result, market commentators almost immediately started speculating on an imminent recession, with the FED claiming that it does not need to be the case (a so-called soft landing).
Keeping a finger on the pulse of the economy and markets
Inflation has been stubbornly high in the face of higher interest rates. This has prompted central banks to keep their policy rates higher, waiting for signs of lower inflation and a slowing economy (usually higher unemployment). Thus far, it seems that inflation might have started to drift sideways to lower. But economies and markets have been resilient (with the main exception being China, which is still struggling with its own (other) challenges).
It is important to note that the impact of a change in interest rates has a lagged effect on the economy, as it takes time for the reduced cash surplus to filter through the economy.
The argument for a limited impact:
In essence, the tools available to governments to influence the economy are either monetary (mentioned above) or fiscal in nature.

One camp argues for a low impact of higher interest rates based on the following thesis:
Given the increase in general government debt levels (in the USA it is 4 times higher than in the early 1980’s), as interest rates go higher, governments must borrow more to pay the higher interest bill. The increased interest paid to investors has the effect of expansive fiscal policy, offsetting the restrictive impact of the monetary policy.
They refer to this phenomenon as “Fiscal Dominance”.
Investigating the historical evidence
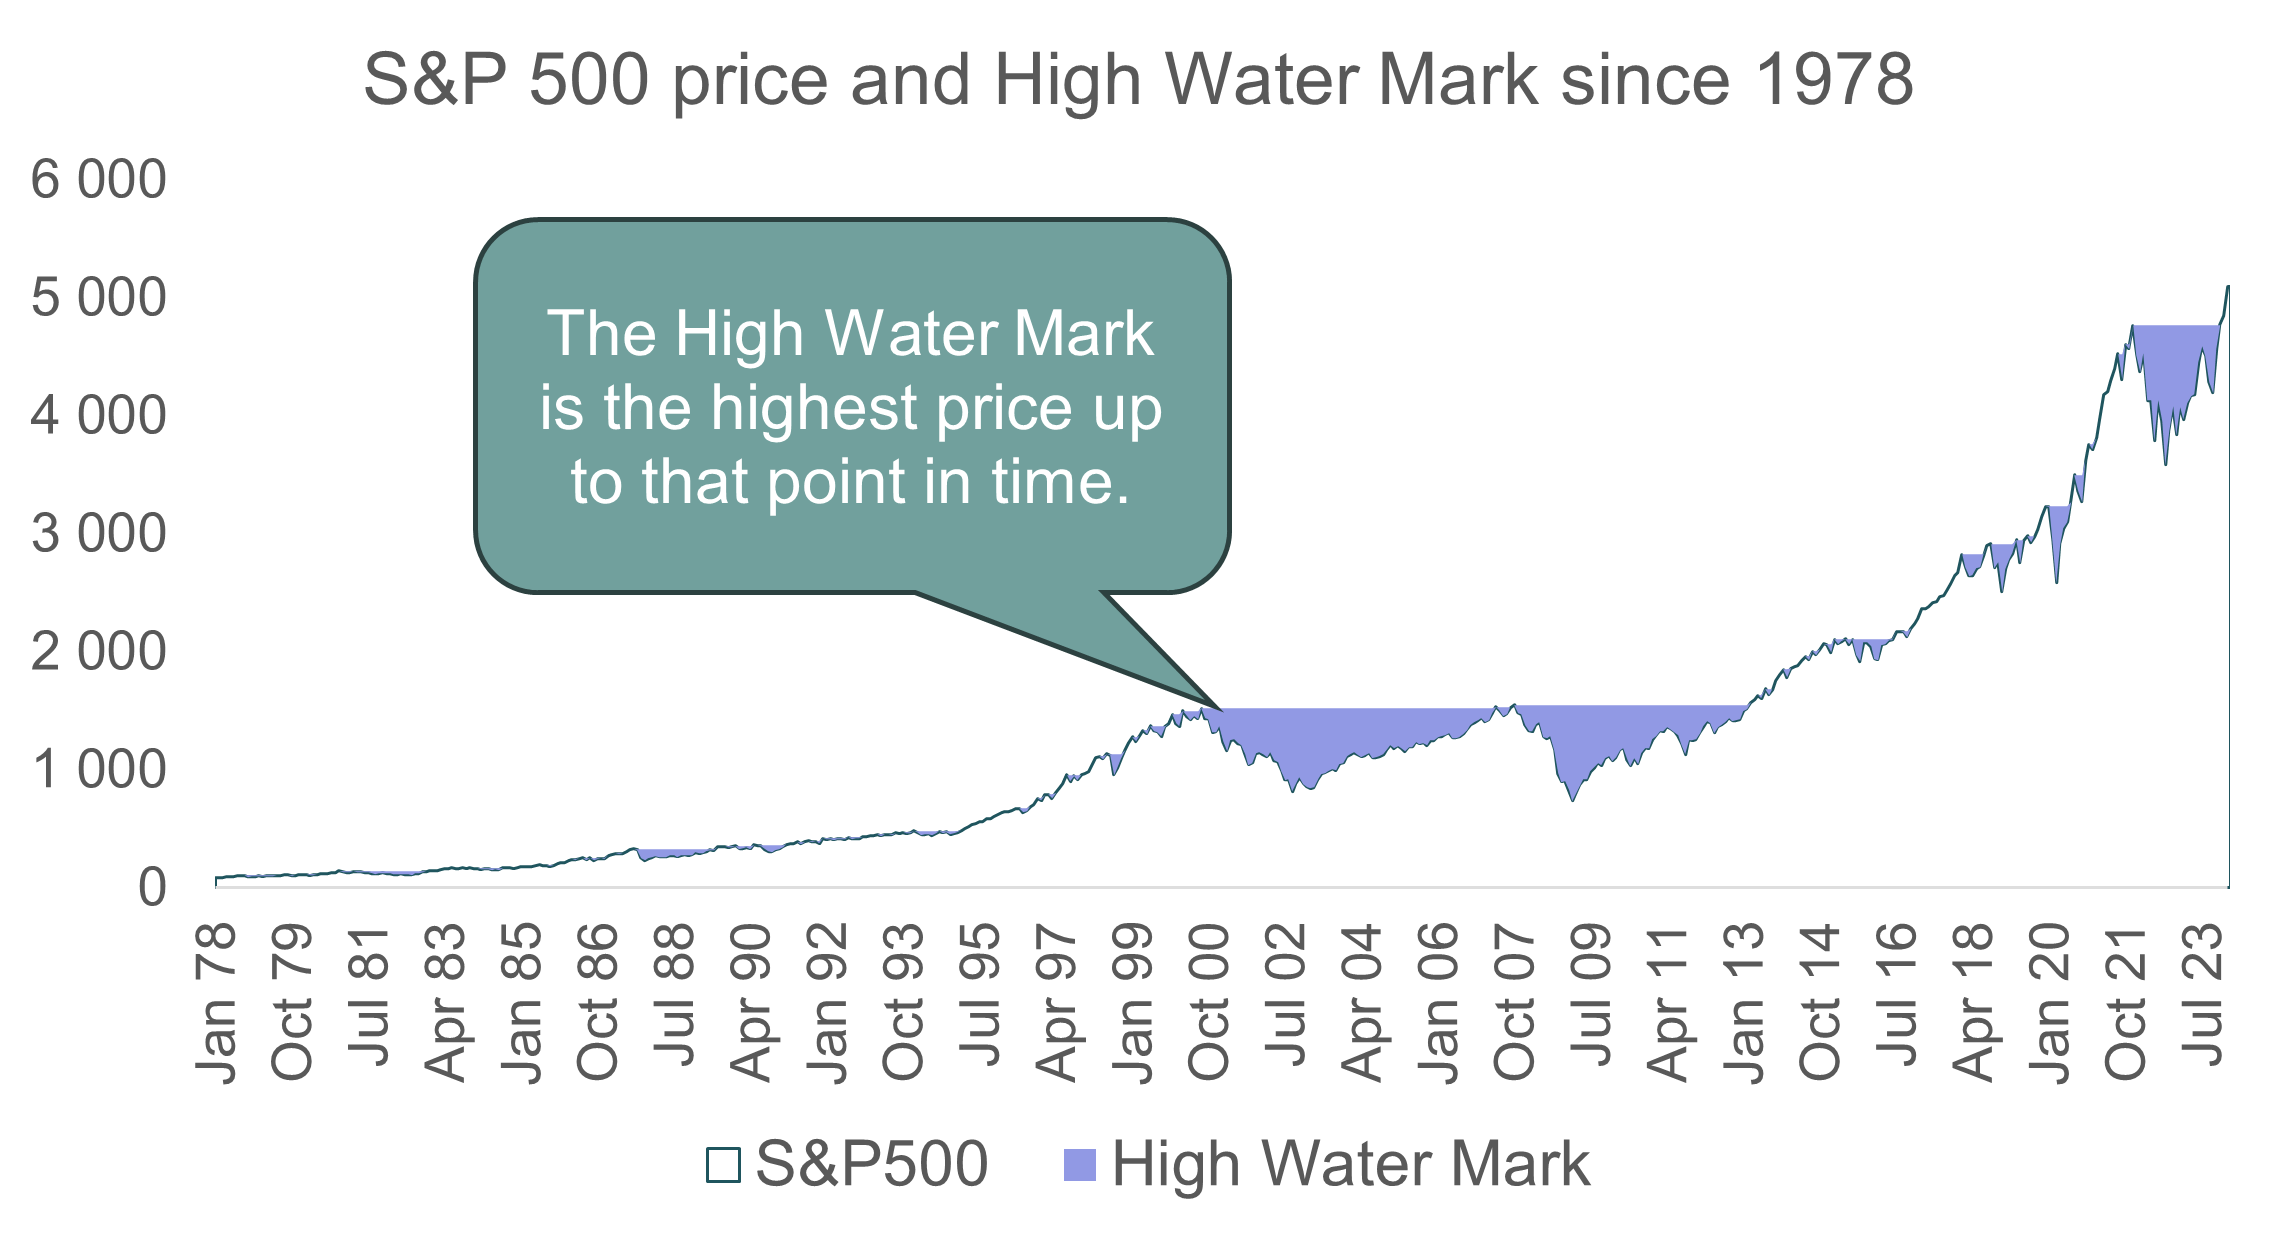
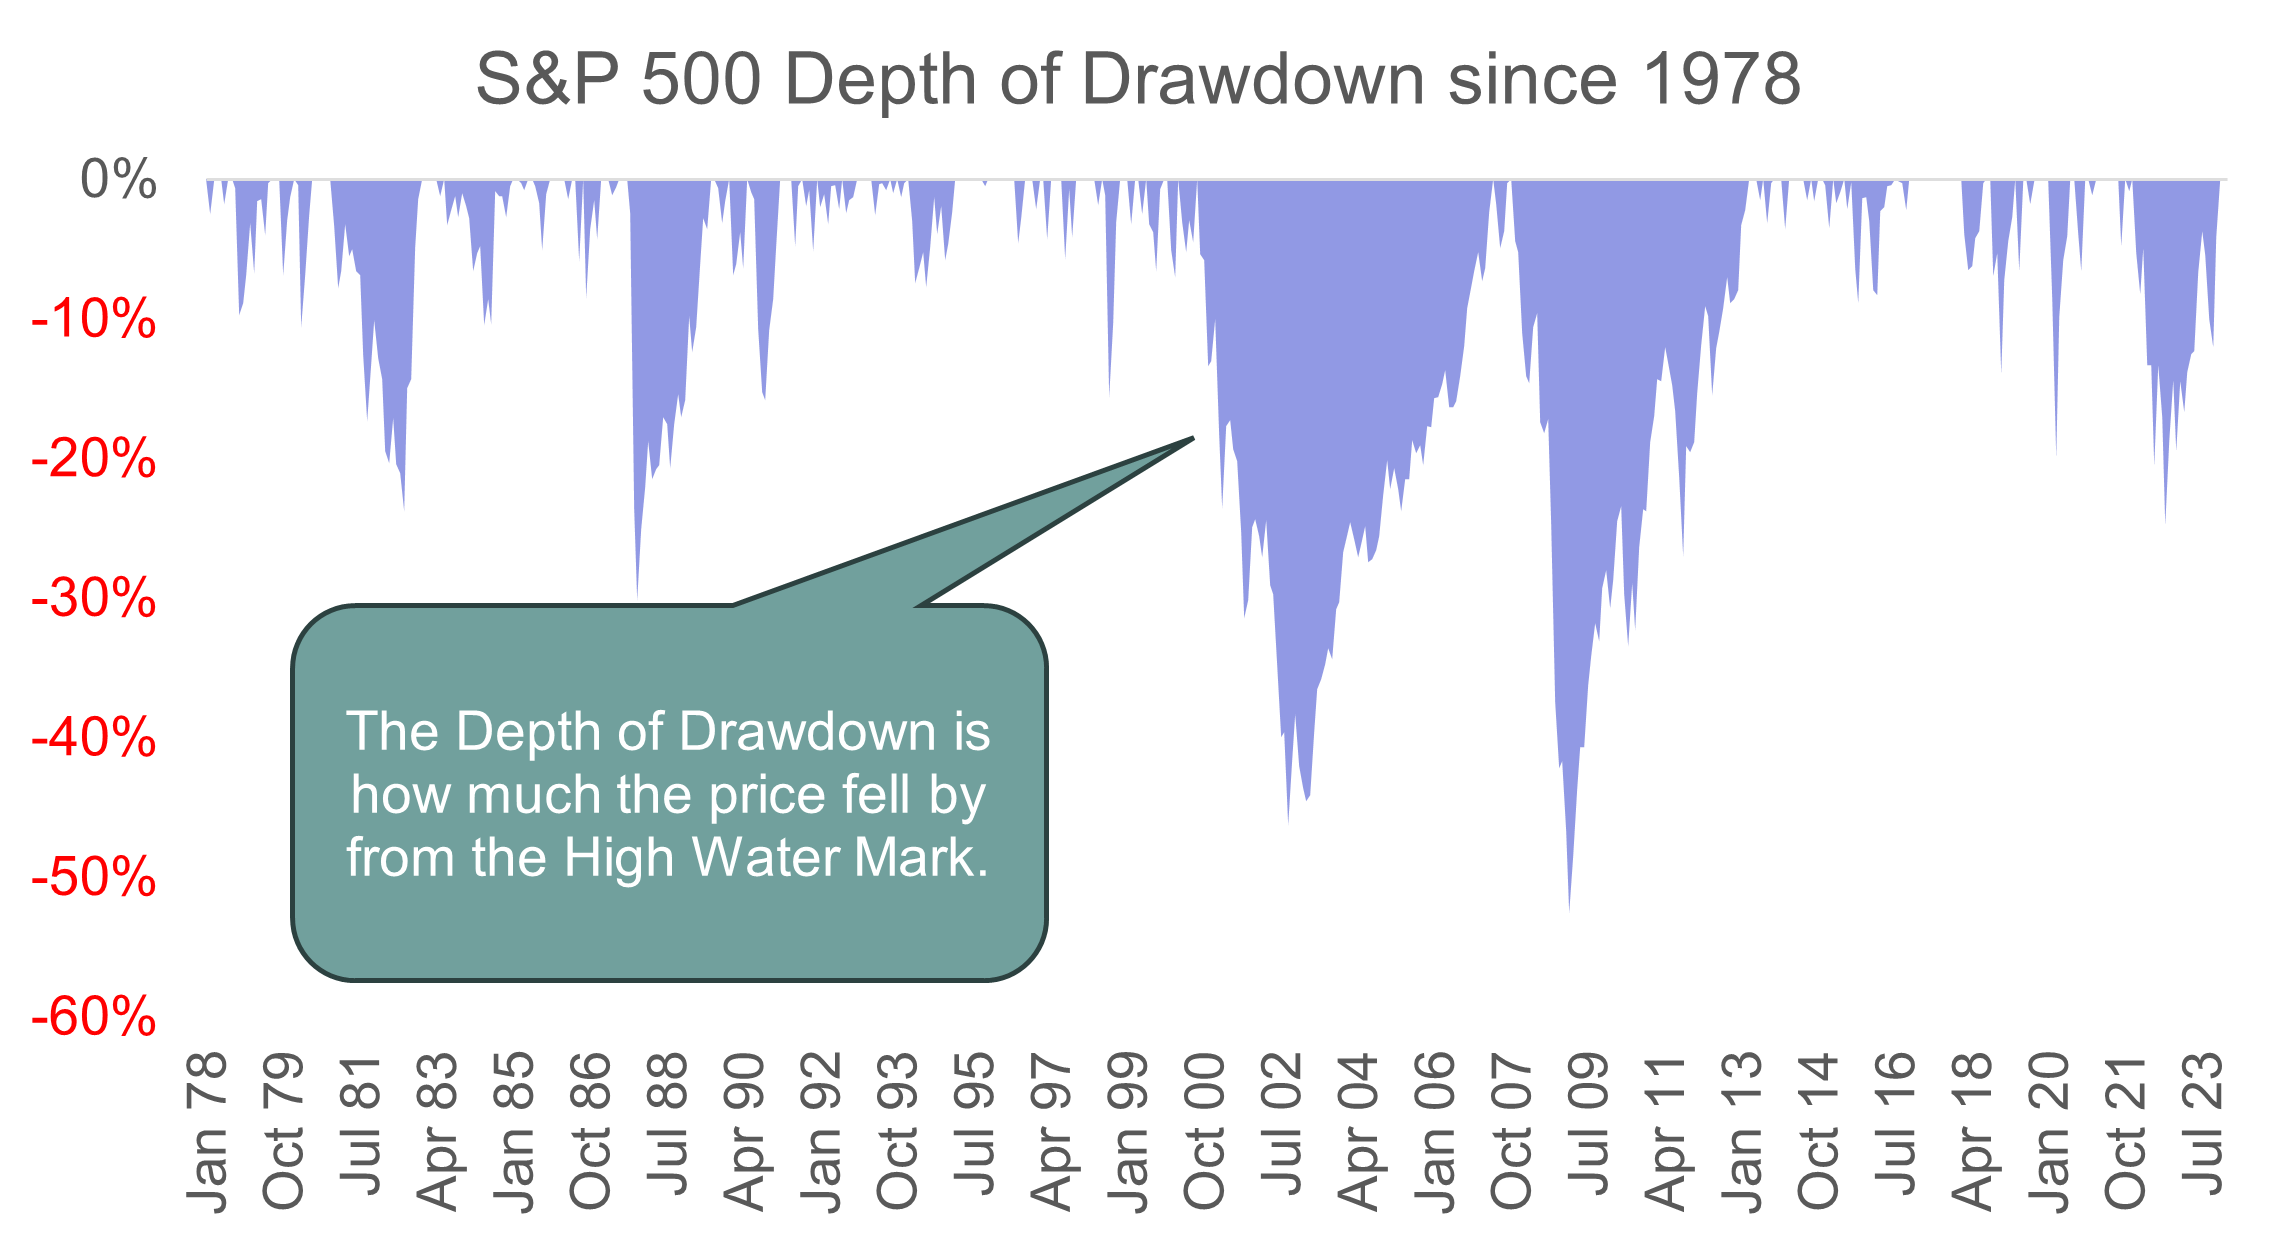
To assess the data, lets revisit some concepts which we will use later.
- High Water Mark
- Depth of Drawdown
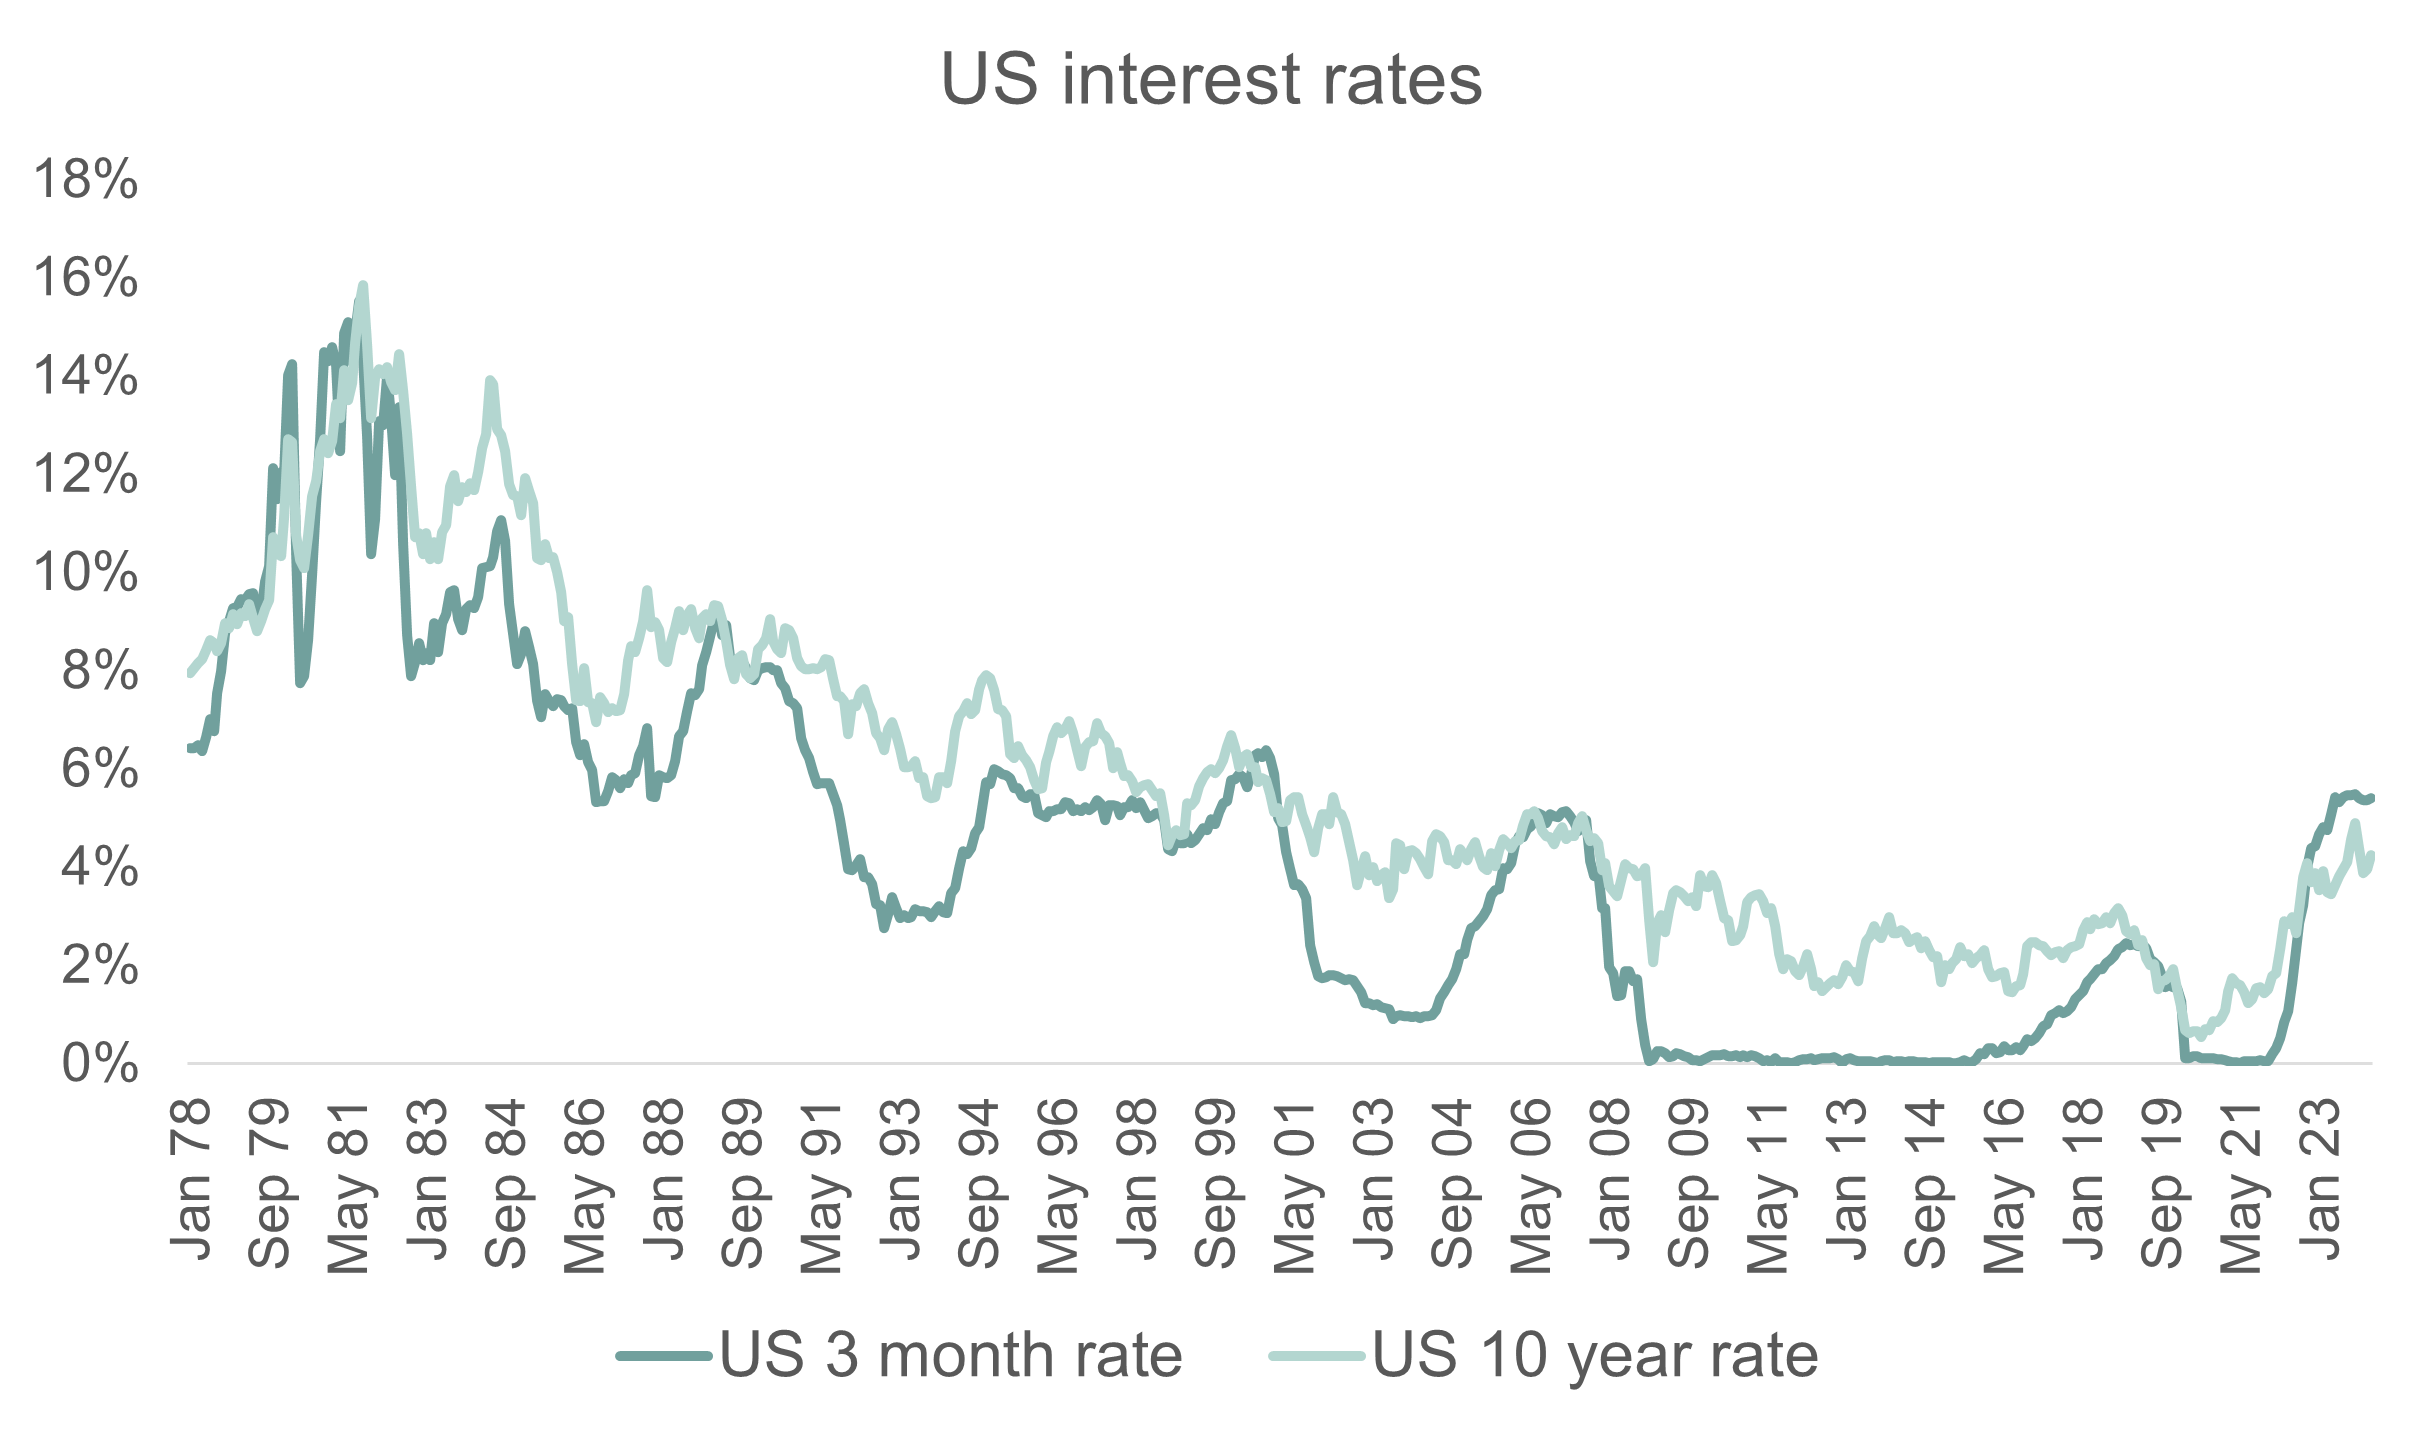
US interest rates
The graph below shows the historical 3 month and 10 Year US interest rate.
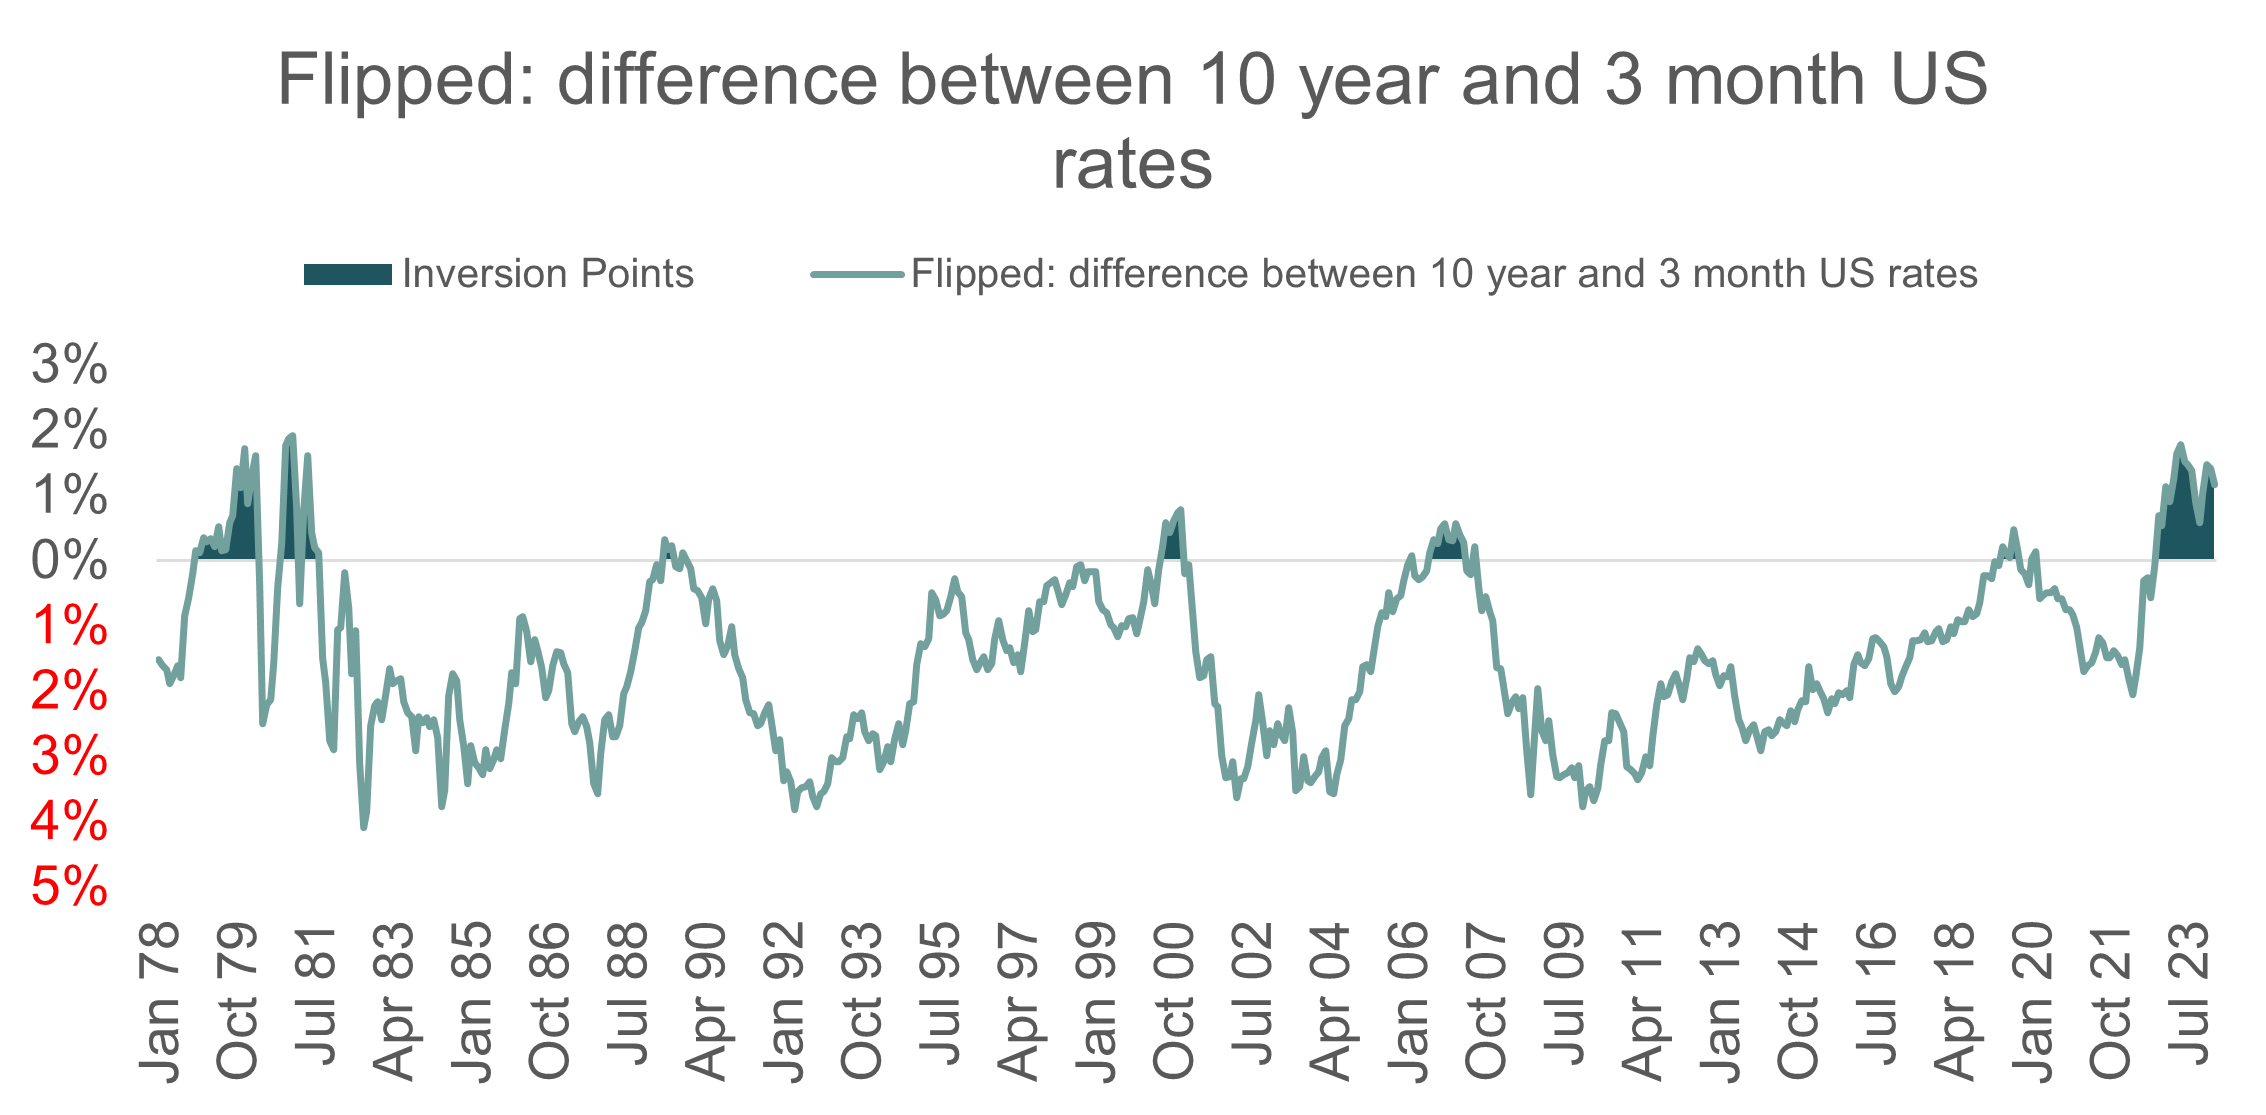
The graph below shows the difference between the 10 year and 3-month interest rates. When the difference is negative, it indicates that short rates are higher than long rates, in other words, the yield curve is inverted.
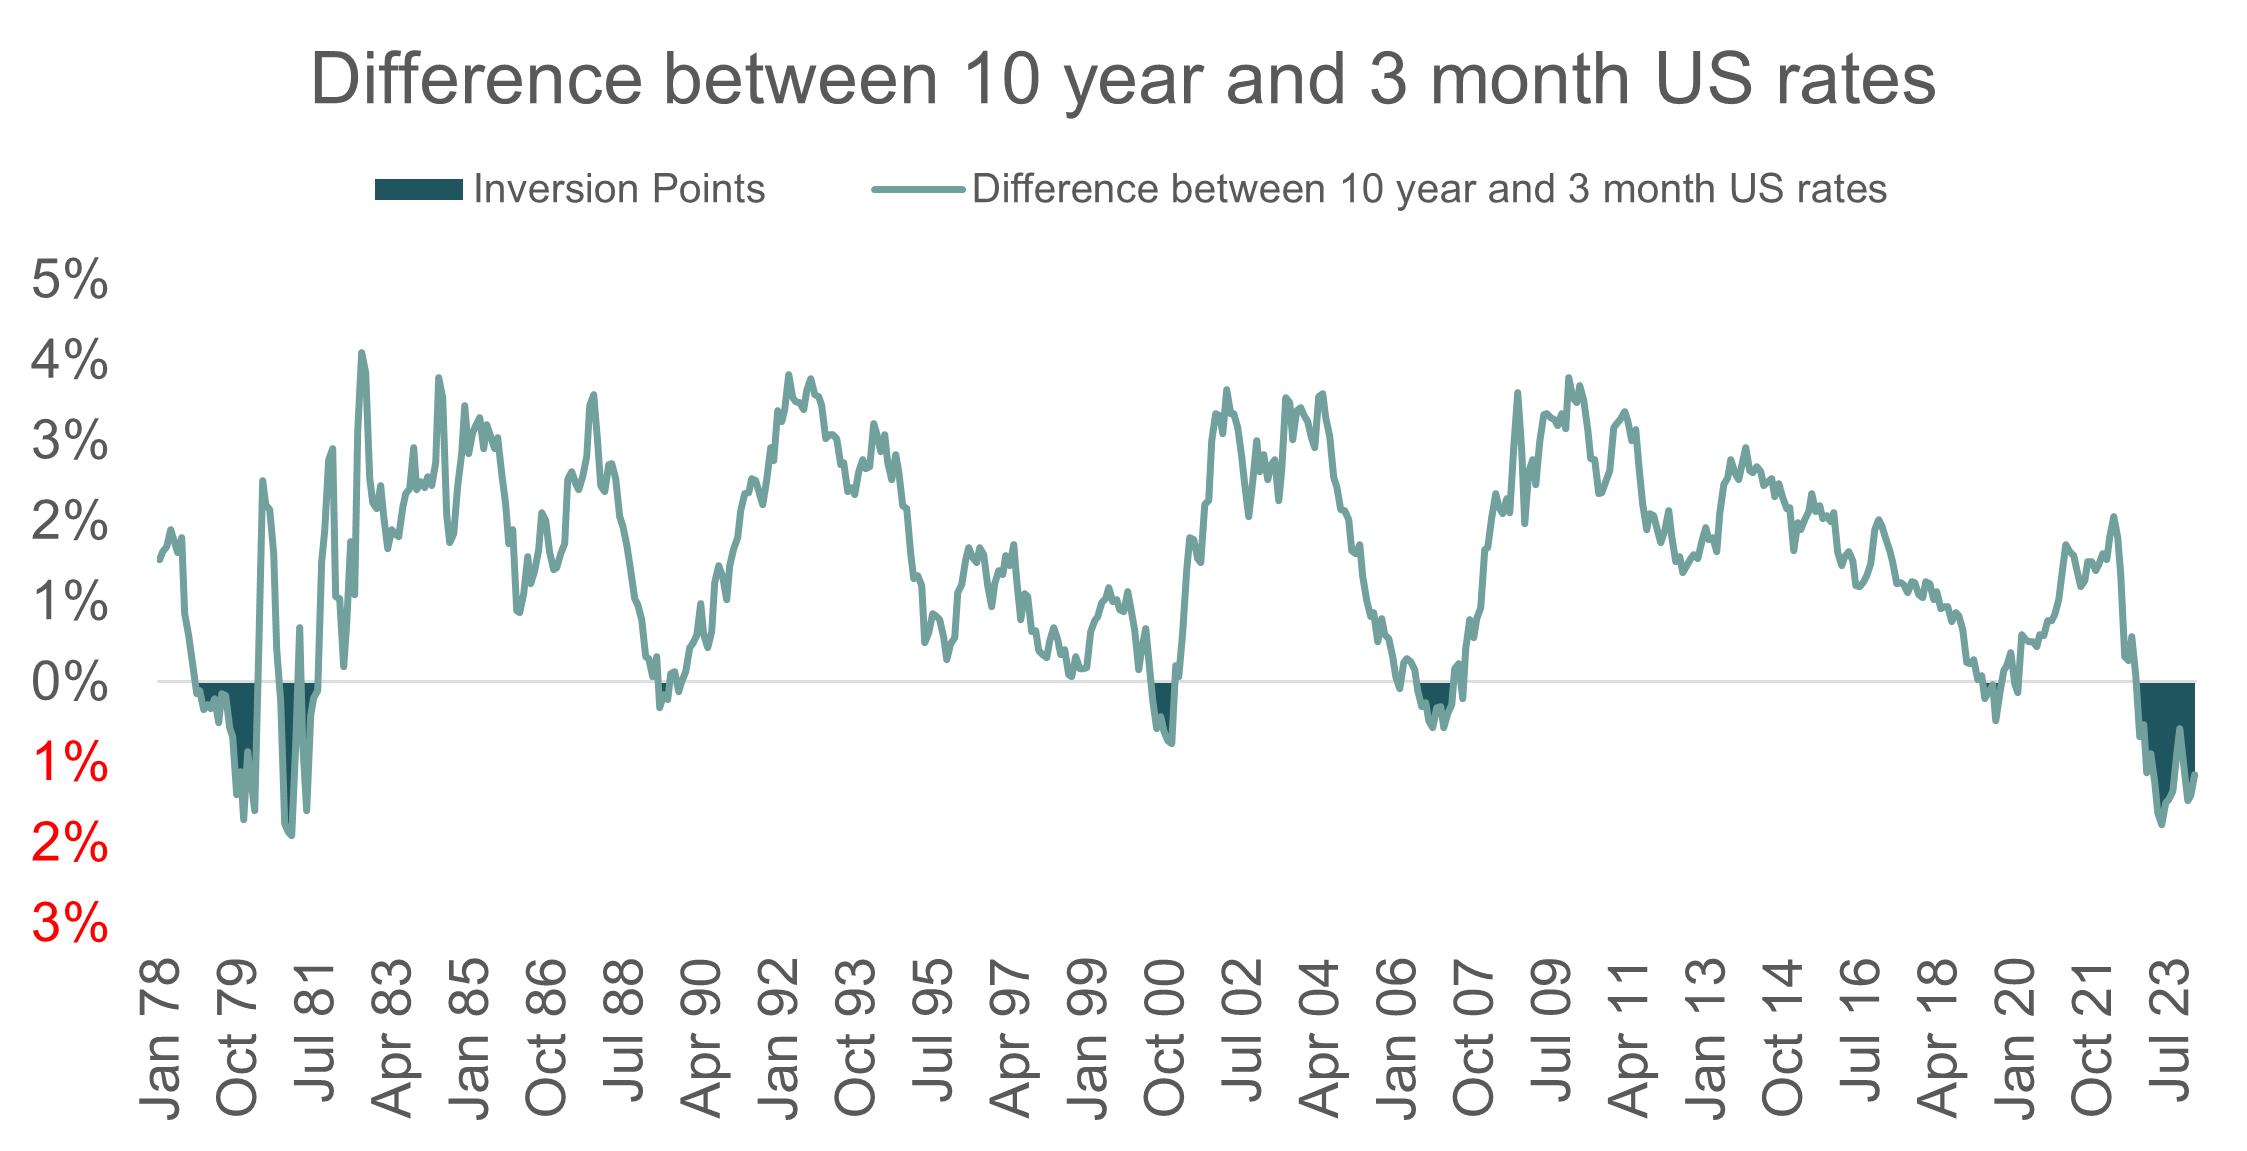
The above representation is the conventional method for showing yield curve inversion. To aid in the visual representation that follows, we have switched it around, (3 month minus 10 year).
Putting it all together
As investors, we are interested in the market impact of changes in the yield curve.
In the graph below, the 5-month rolling average of the S&P 500 drawdown and the 3-month minus 10-year interest rate difference is shown. When the line showing the interest rate differential moves lower, it indicates a steepening of the yield curve.
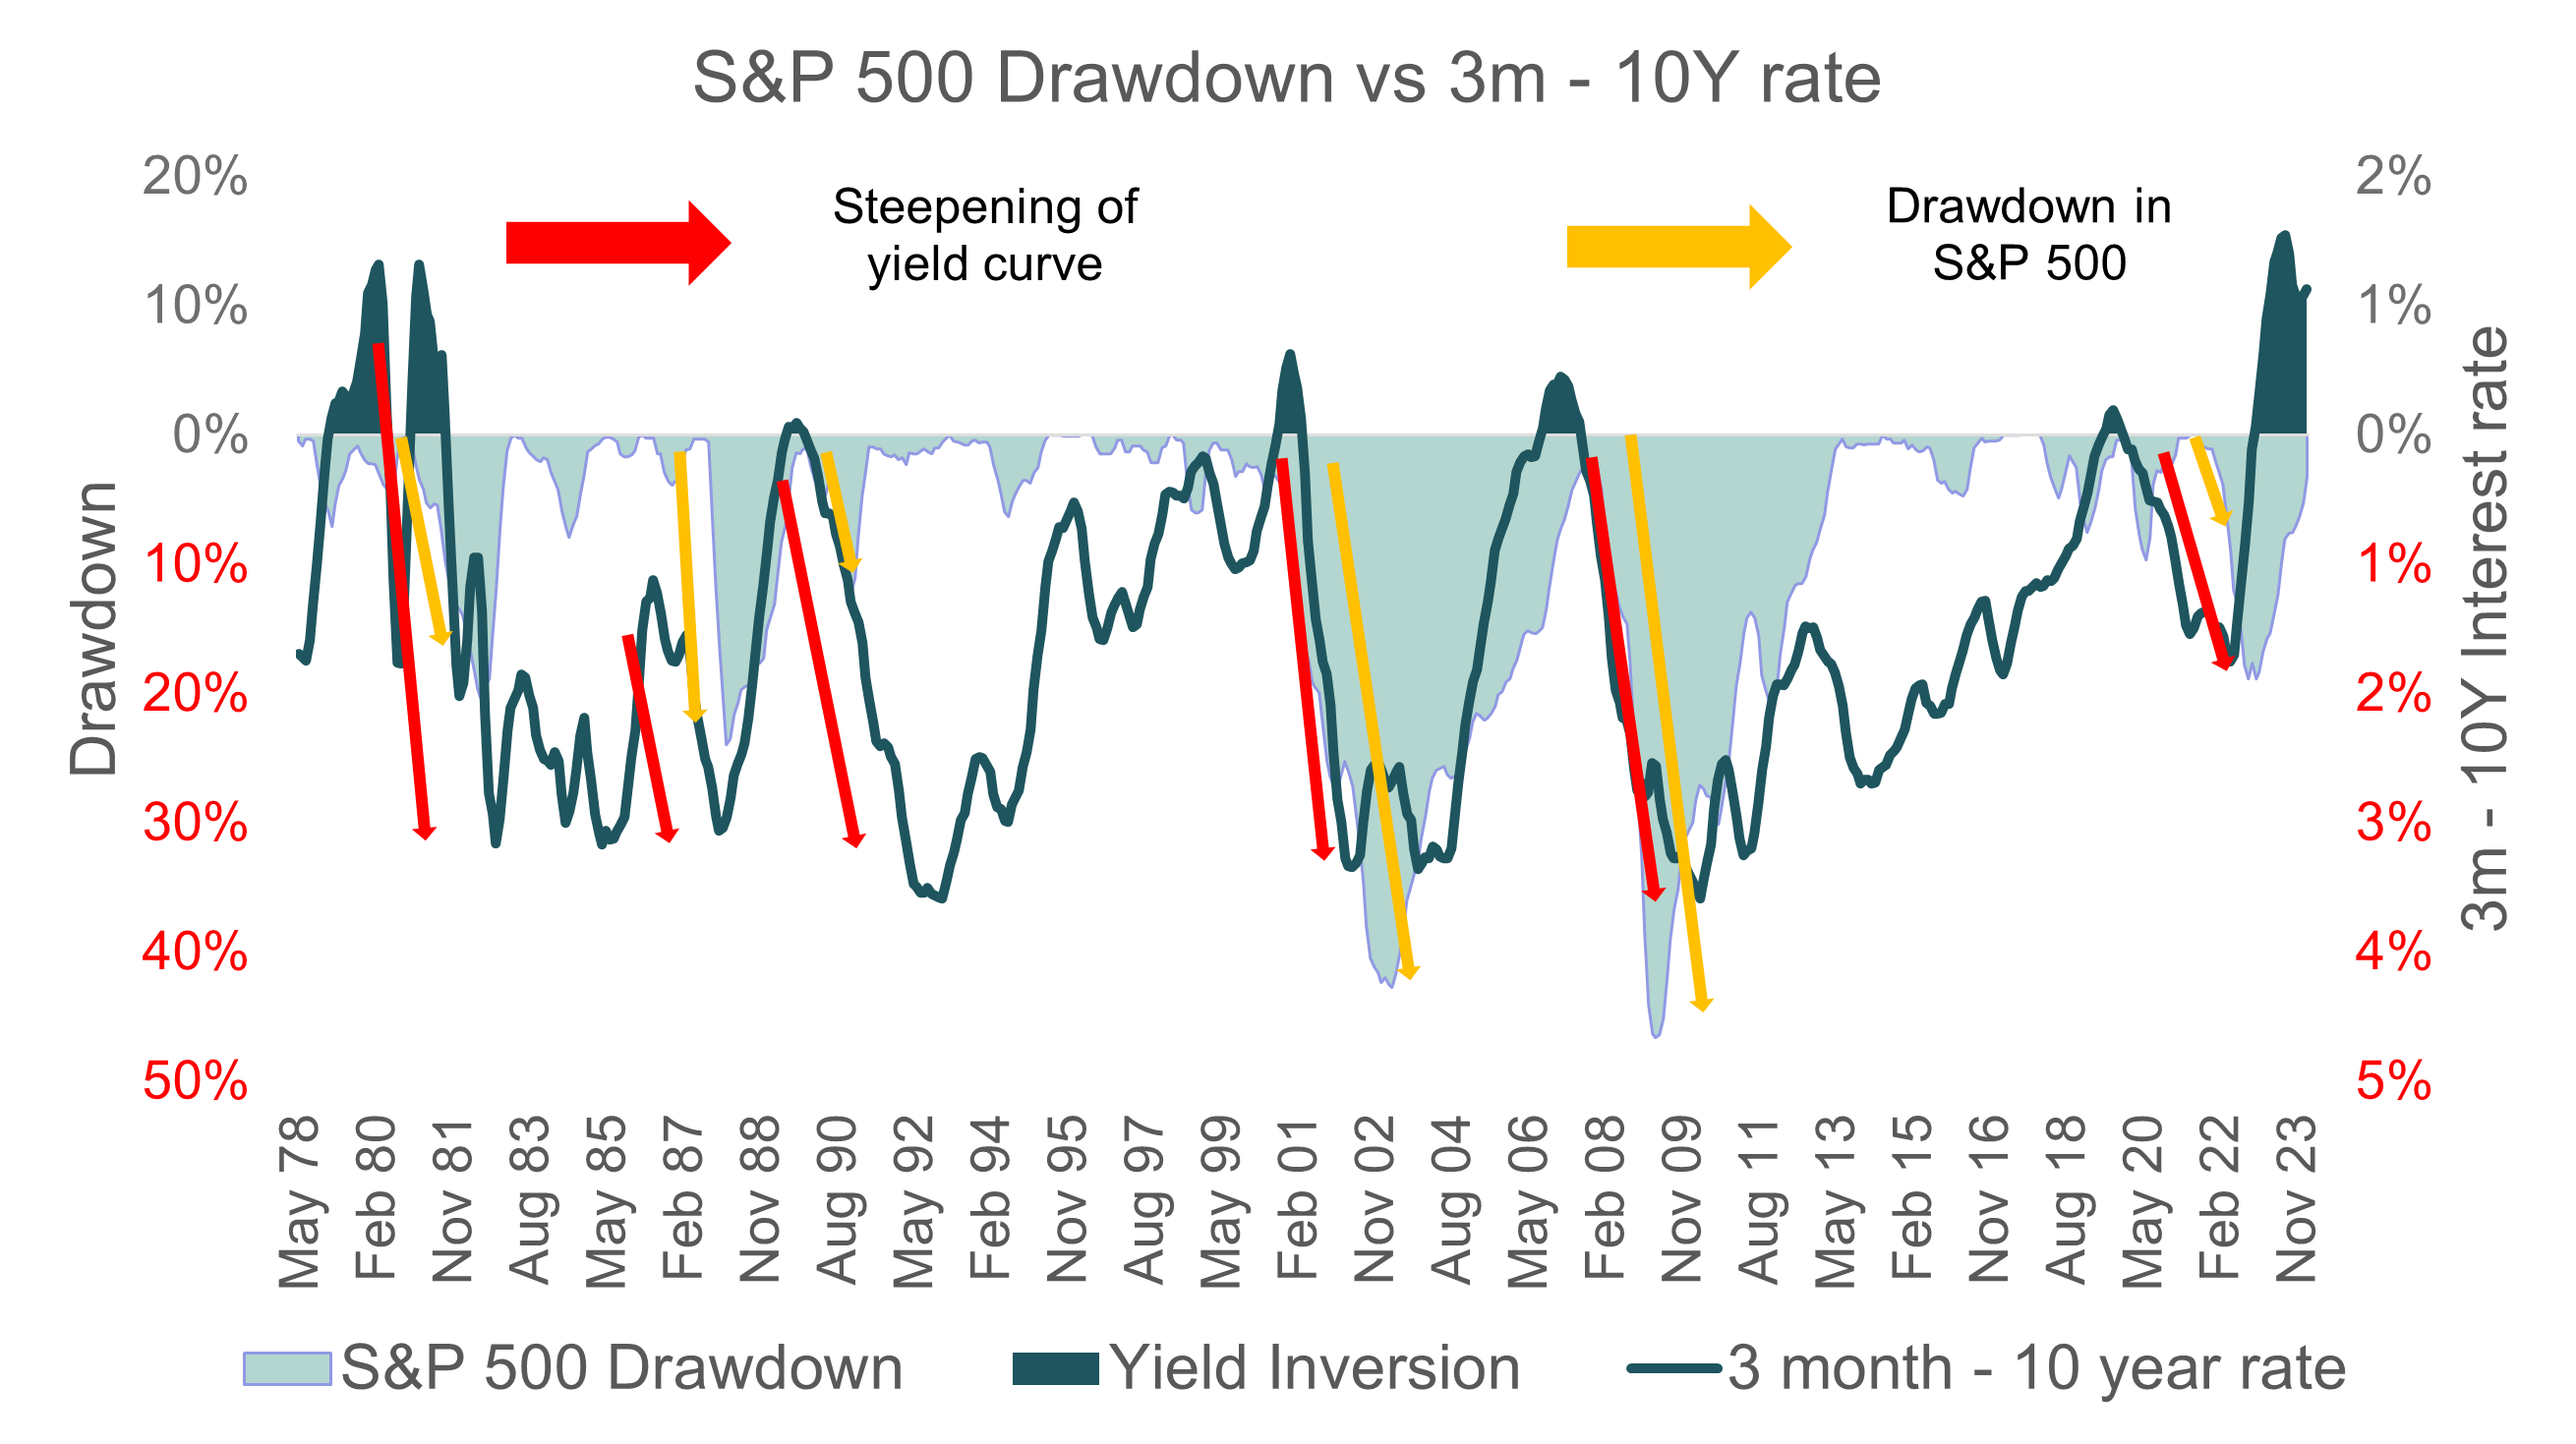
Historically, the S&P 500 goes into drawdown after a significant steepening of the yield curve. These events are shown by the red arrows. The amber arrows show subsequent drawdowns in the S&P 500.
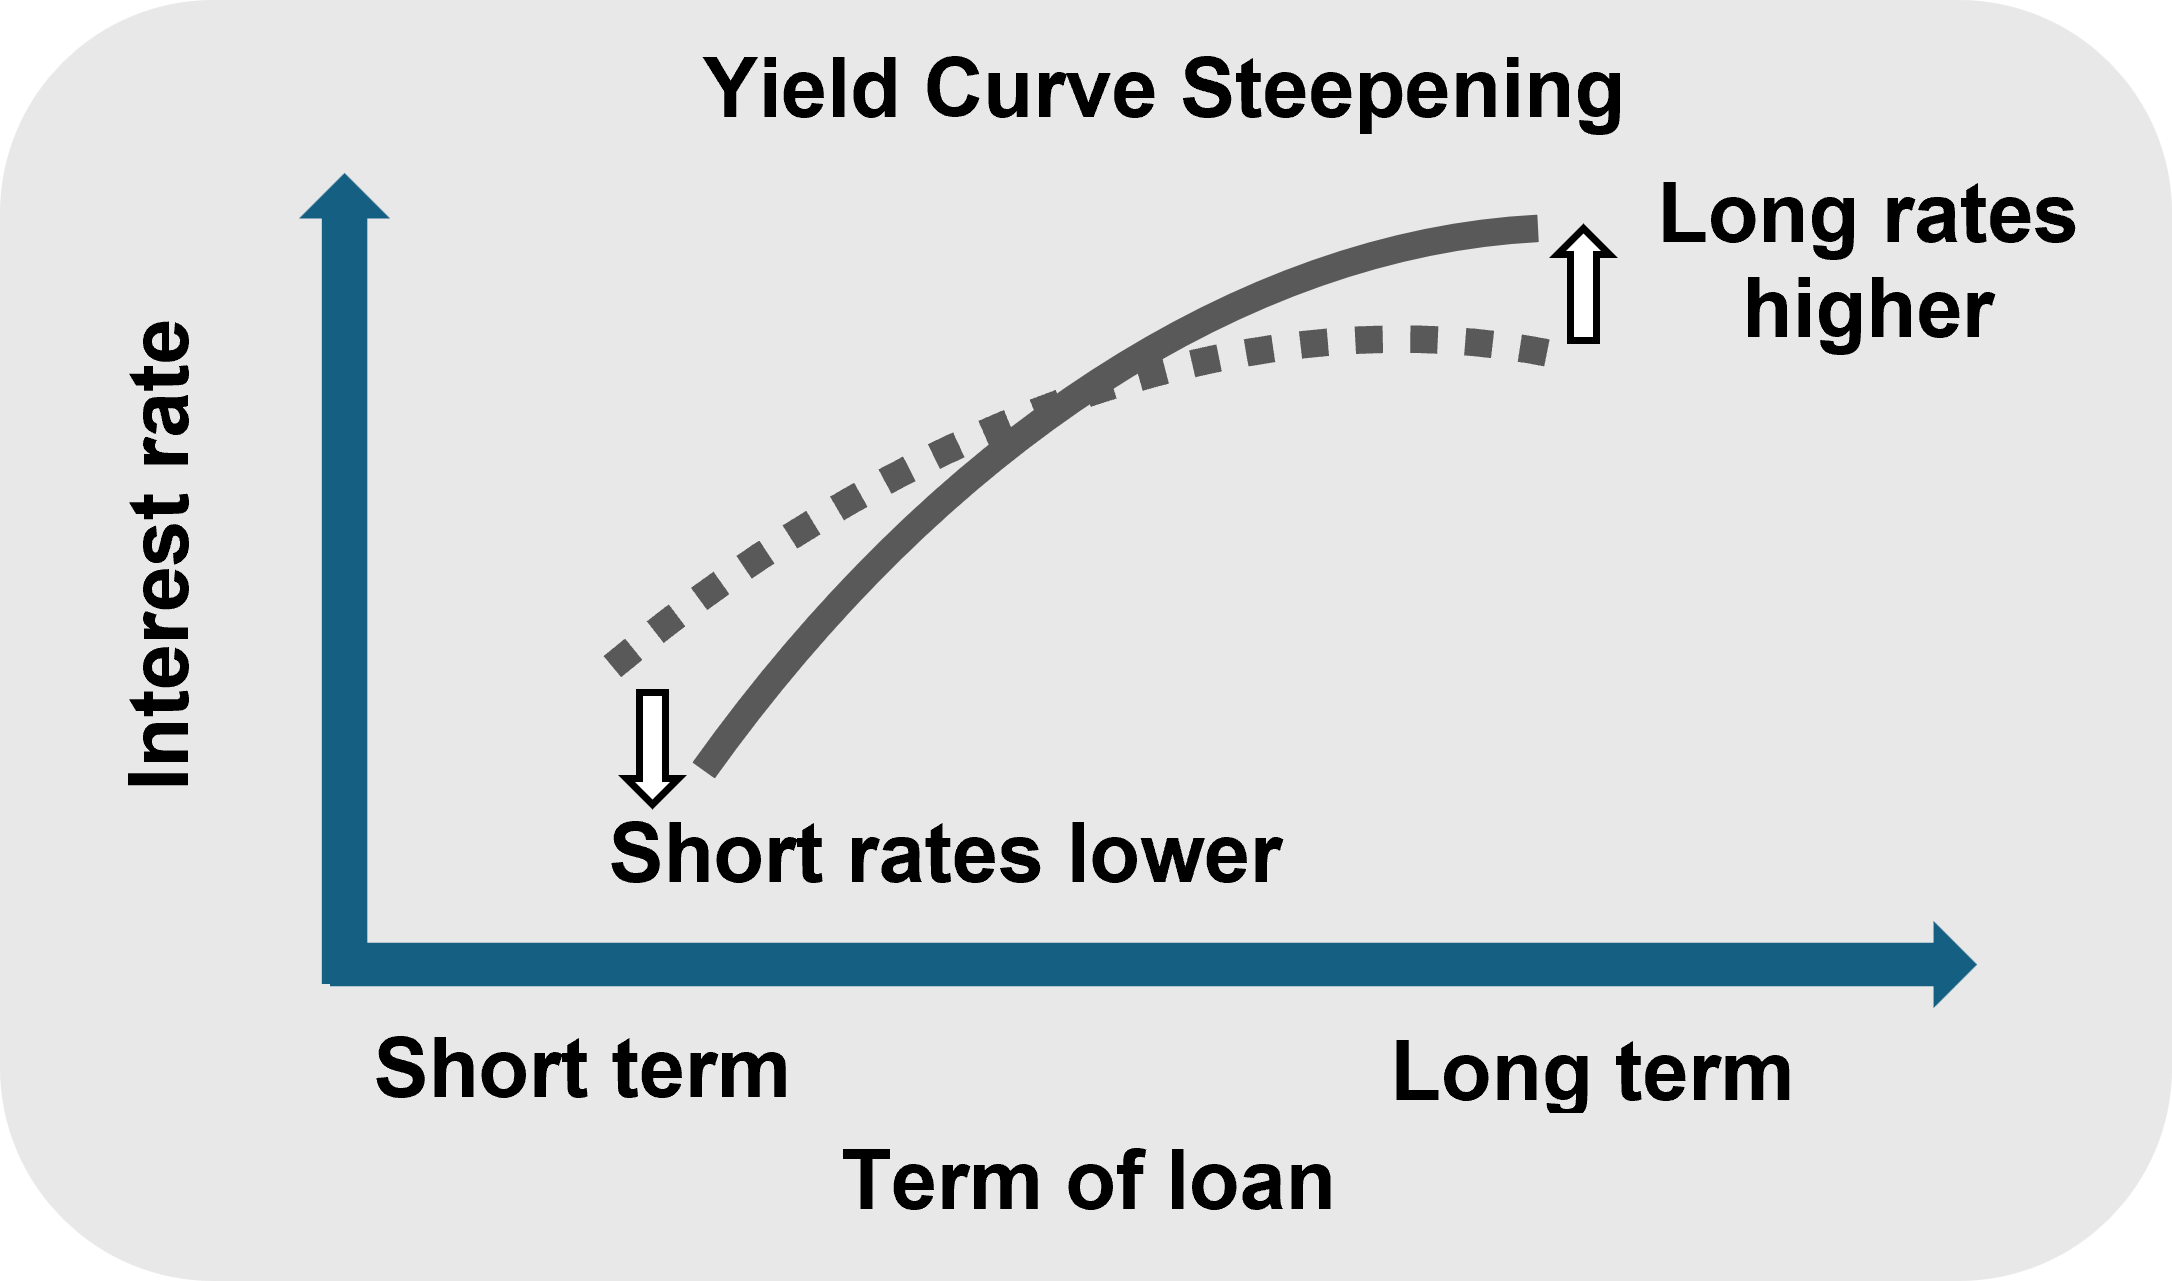
The lag between the steepening and the drawdown varies and the question therefore becomes: when would we be able to claim that there was a “soft landing”?
From a historical point of view, the answer is: If there was no significant drawdown after the yield curve completed its steepening process.
At present, the yield curve is almost at its most inverted level since 1978. The level of invertedness has moderated to some extent, but it is far from a normal yield curve.
We therefore conclude that, despite the “Fiscal Dominance” argument, it is too early to judge if the FED was successful in orchestrating a soft landing.
We have not seen an appropriate amount of yield curve steepening to conclude that there has been a soft landing. As a result, we remain cautious as there is no indication that this time is different.
View the March 2024 Market Summary
ViewABOUT THE AUTHOR:
Henk Myburgh, CFA®- Head of Research
After completing a BCom Econometrics and MSc in Quantitative Risk Management at the North-West University, Henk Myburgh (CFA), started his career in financial risk management at HSBC. He also worked at Sanlam Capital Markets, where his focus was on consolidation of financial risk across the firm and management of risk on a holistic basis. In 2018 he founded AlQuaTra, a quantitative private hedge fund.


