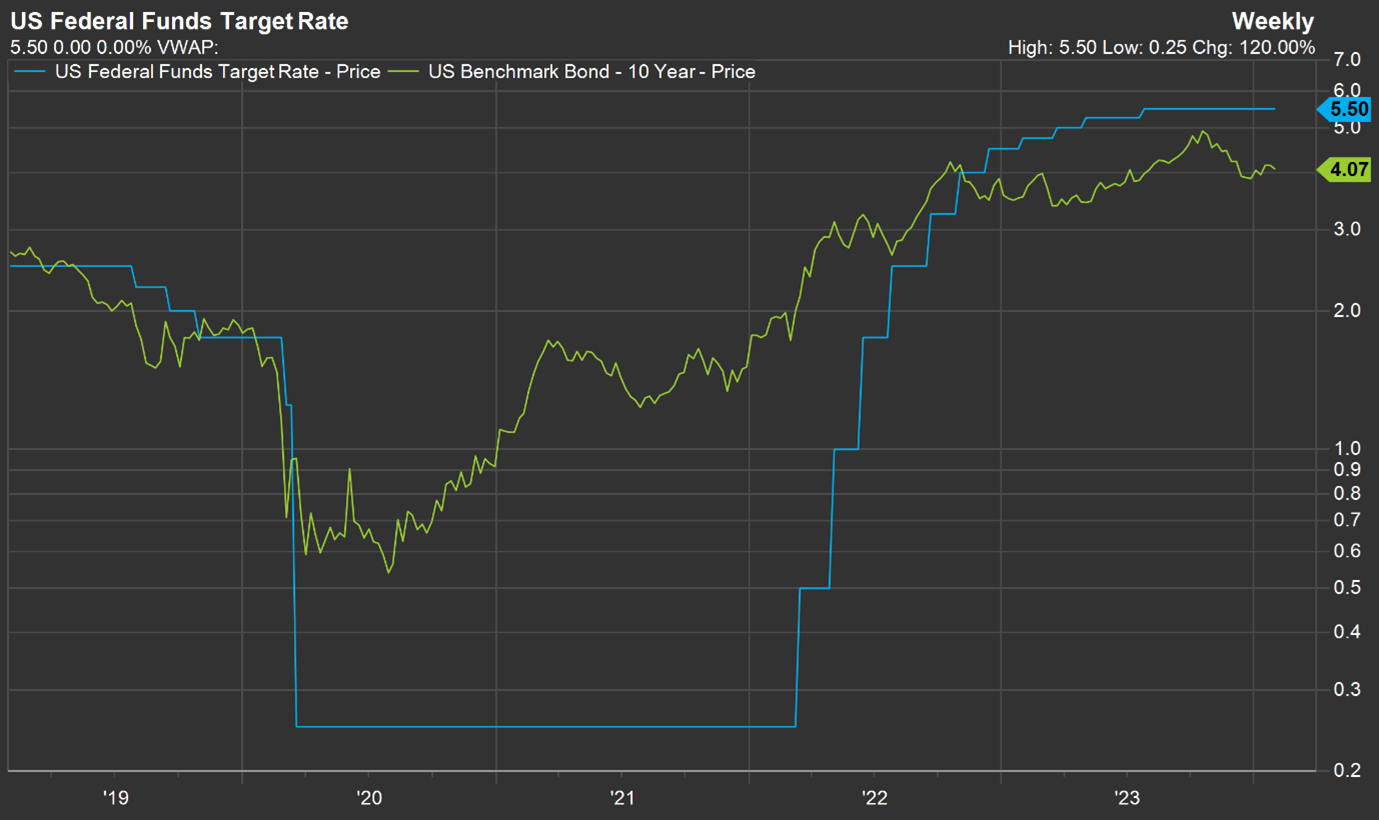
In response to rapidly increasing inflation, the Federal Open Market Committee (FOMC) of the US Central Bank or the “Fed” (Federal Reserve System) started raising the Fed Funds rate on 17 March 2022. Since then, the FOMC has raised the Fed Funds rate by a cumulative 5,25%, from 0,25% to the current 5,50%. This “tightening” cycle in the Fed Funds rate has been reflected in market interest rates across the maturity spectrum, in other words, short-, medium- and long-term interest rates have risen. For instance, the interest rate on the benchmark US bond with a maturity of ten years has risen from an all time low of around 0,5%, before the onset of the hiking cycle in the Fed Funds rate, to in excess of 4% currently.
Source: FactSet
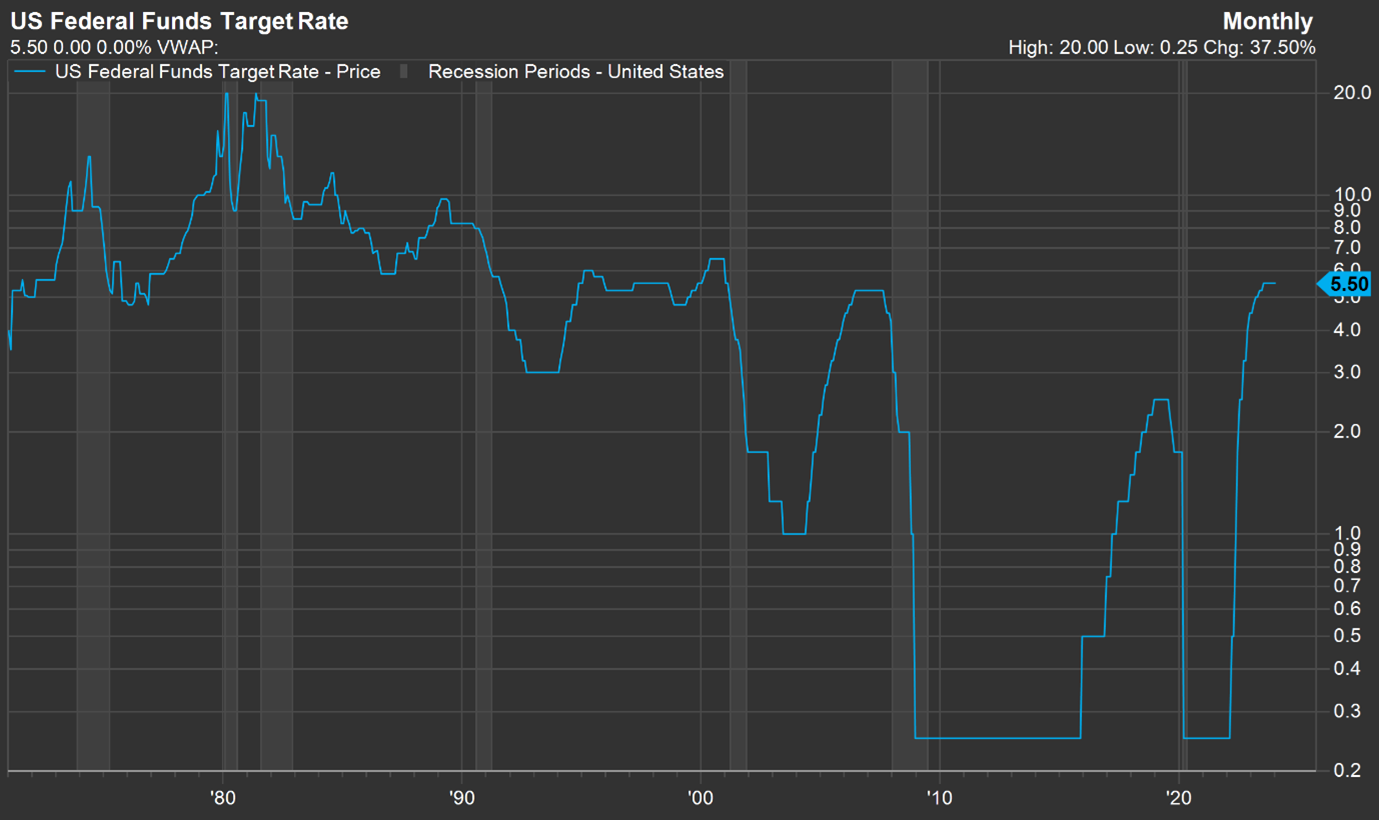
The directional move in interest rates (in essence, the cost of money) is important as it has an impact on economic activity. In simple terms, when interest rates trend lower, the cost of money becomes less or borrowing becomes cheaper, which entices consumers and corporates to borrow money to spend or invest. The opposite is also true. This relationship between interest rates and economic activity is shown in the chart below. The Fed Funds rate is plotted and US economic recessions are shown in the shaded areas.
Source: FactSet
From the chart above it is clear that increasing interest rates precede economic slowdowns and in fact, interest rates tend to peak shortly before an economic slowdown or recession. It is therefore not surprising that market commentators, economists and strategists have been debating whether a recession is looming. One view is that the Fed has succeeded in engineering a “soft landing” and that the US economy is healthy enough to withstand the higher cost of money. On the other side of the debate is the camp that argues for an imminent recession. This group builds its argument on an analysis of the term structure of interest rates, or the so-called Yield Curve.
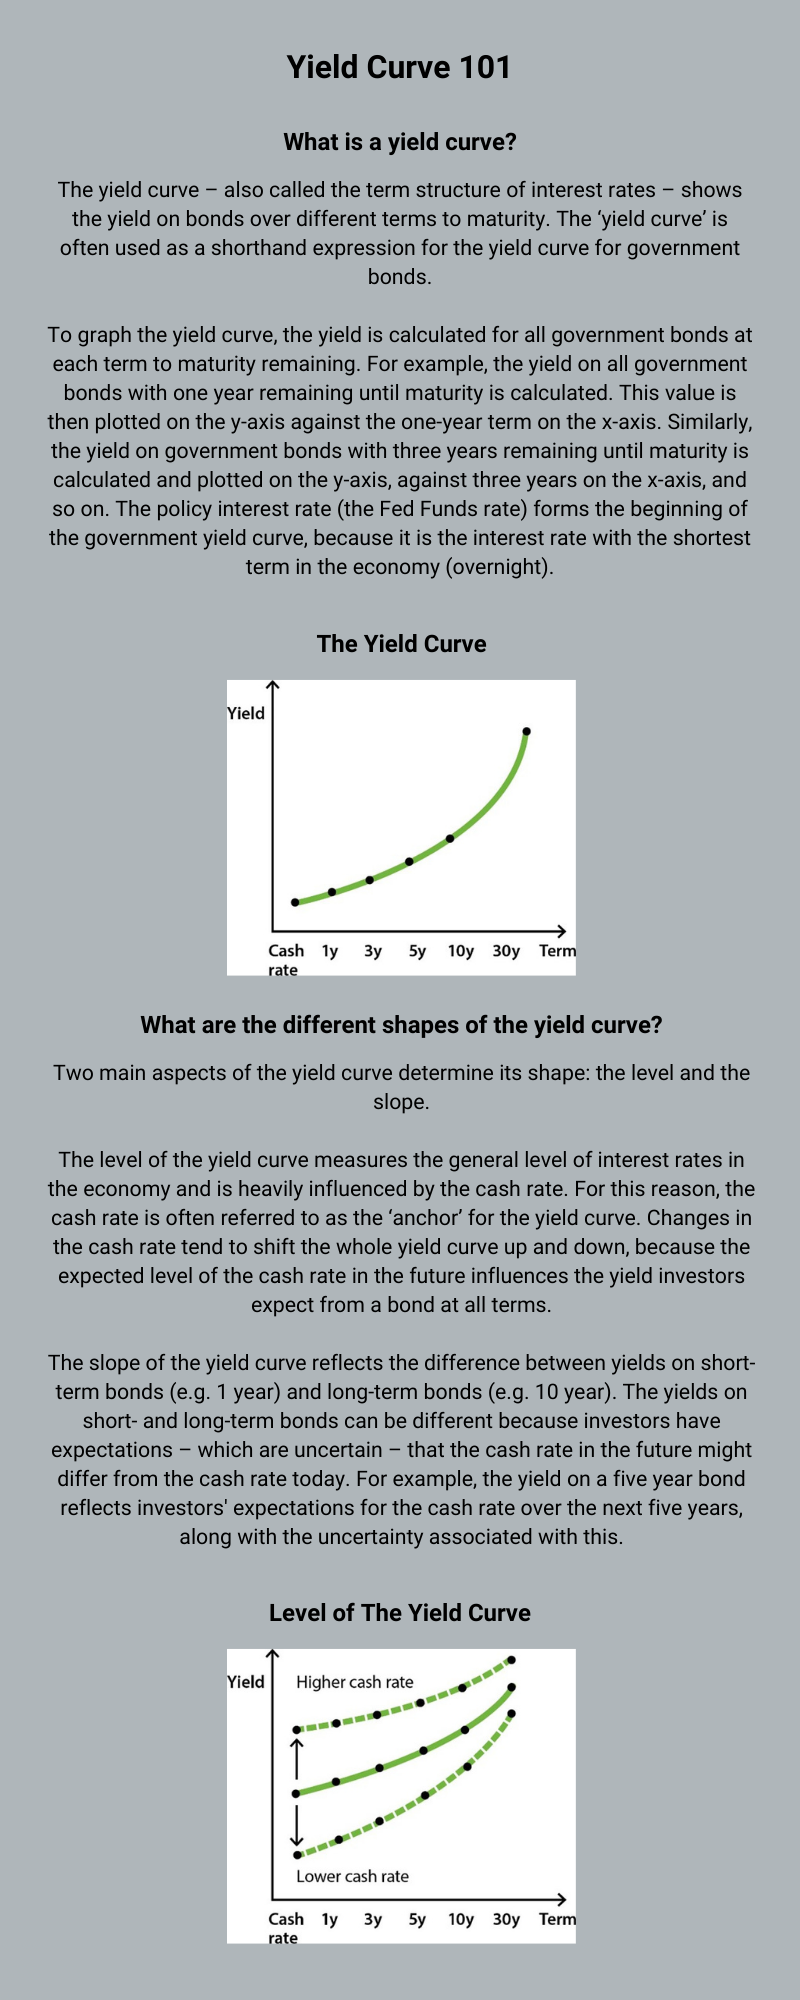
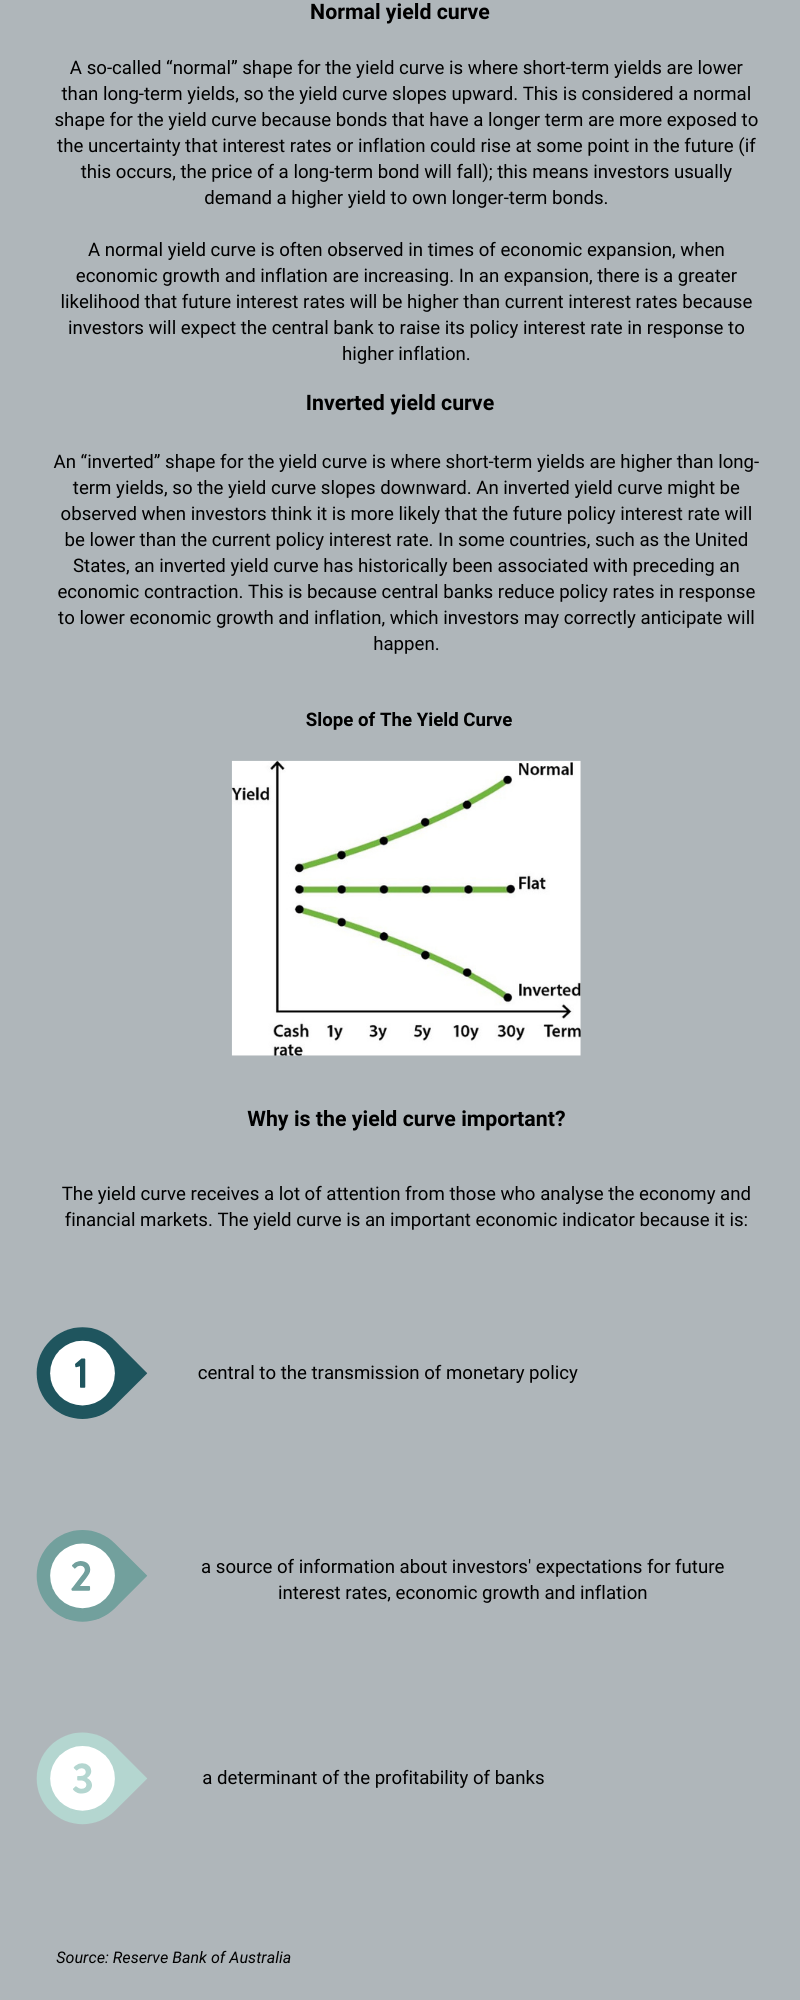
One proponent of the view that higher interest rates will likely cause a recession is Campbell Harvey, Partner at US based Research Affiliates. He has done extensive research on the topic as early as 1982 when he was tasked, as a masters degree student, to create an economic model to forecast real US GDP (economic) growth. In 1986, Campbell completed his PhD and his dissertation documented the relation between the Yield Curve and economic growth. Campbell’s research showed that an inverted Yield Curve successfully forecasted recessions and indeed, since then, the same held true.
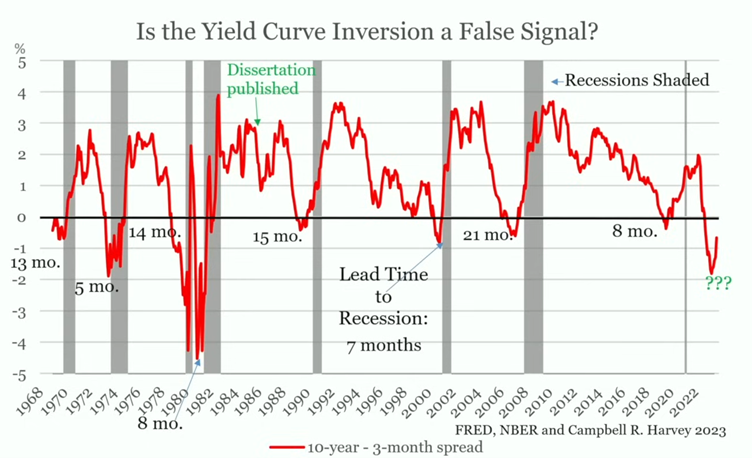
The red line in the chart above represents the Yield Curve. When the red line falls below the horizontal black line, the Yield Curve has inverted (short-term interest rates exceed long-term interest rates). The shaded areas represent recessions. The chart shows that every recession was preceded by an inverted Yield Curve. Not one false signal.
An analysis of the above chart shows that the last 7 times the Yield Curve inverted, the average lead time from inversion to recession was 11 months. As it stands currently, the Yield Curve inverted 12 months ago. Another interesting observation is that recession occurs when the Yield Curve “re-inverts”, i.e. when the red line crossed back above the black horizontal line. In other words, Yield Curve inversion gives the recession warning while the recession typically coincides with re-inversion.
Despite the recent recession signal, the US economy appears to be holding up well. The US labour and housing markets remain reasonably resilient. However, unemployment tends to be at a low point just before recessions. Recent announcements from large corporations regarding layoffs may be seen as a canary in the coal mine. Is it possible that the Fed has raised rates too much and too fast? Time will tell.



1 Comment
Comments are closed.