Before we can discuss the potential role of alternative investments in a portfolio it is worthwhile reminding ourselves of one of the basic principles of portfolio management, namely diversification.
Portfolio construction and diversification
Let’s say that we have identified two assets that we would like to invest in. We will call them asset A and B. Historically, the assets have a certain average return, variation of return, as well as correlation coefficient (a measure of how assets perform relative to one another). We will use the variation of returns, or volatility, as a measure of the risk associated with each investment.
To extend our example, we summarise hypothetical risk and return numbers in the table below:
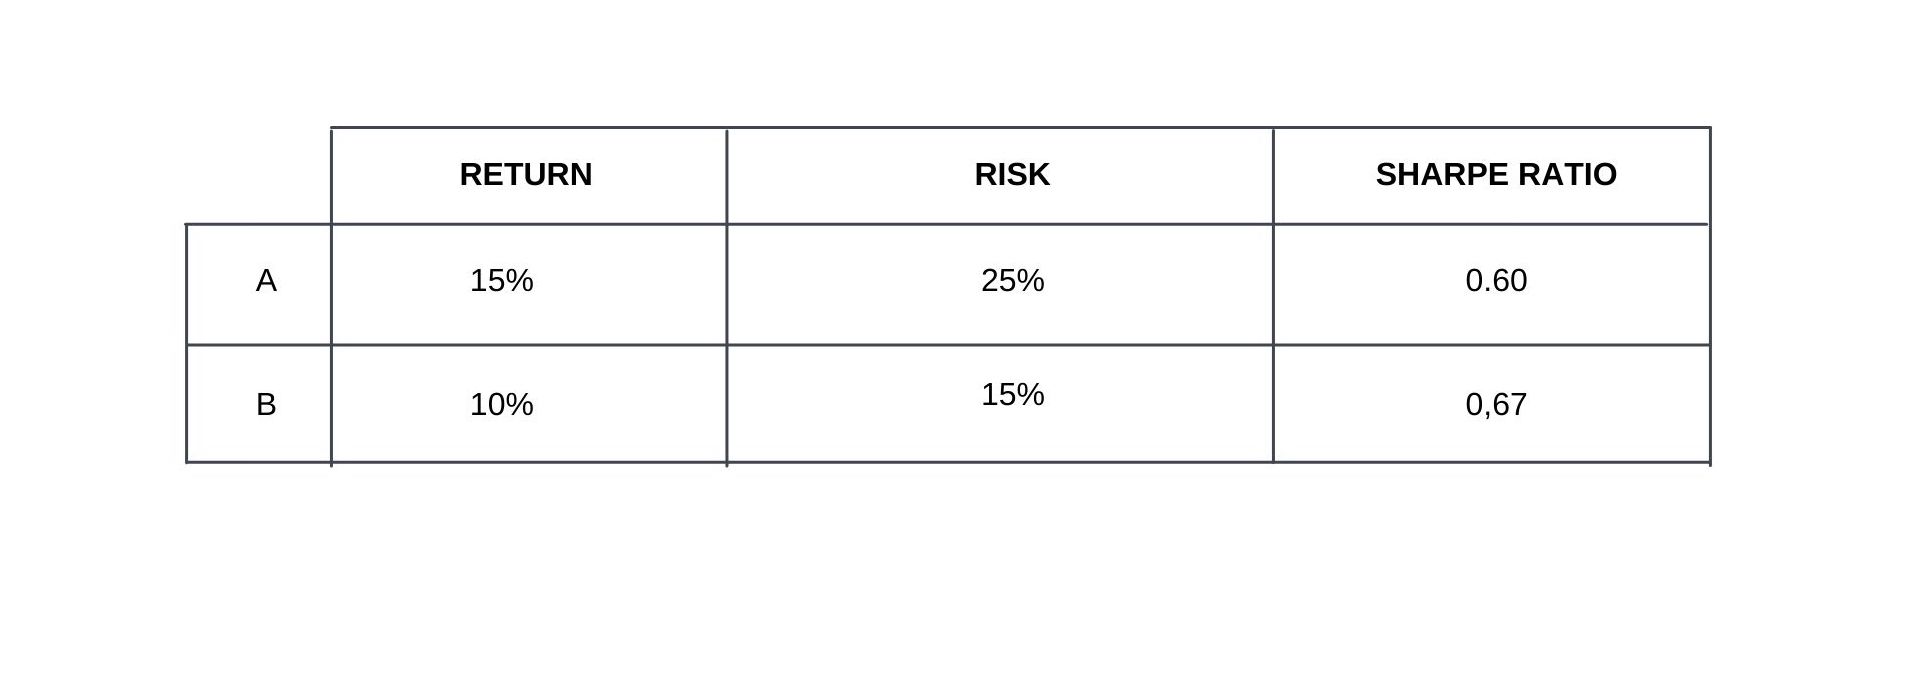
Note: the Sharpe ratio is defined as the excess return over the risk-free rate, divided by the volatility of returns. For ease of use, we will ignore the risk-free rate in this example.
Let’s say that we want to invest all our money into these two assets. The question that we need to answer is how much of each asset we want to buy. This is where the co-movement or correlation amongst assets comes into play.
We can represent all the possible combinations graphically for three scenarios.
- Perfect correlation,
- Correlation of 0.5 and,
- Independence (correlation of zero).
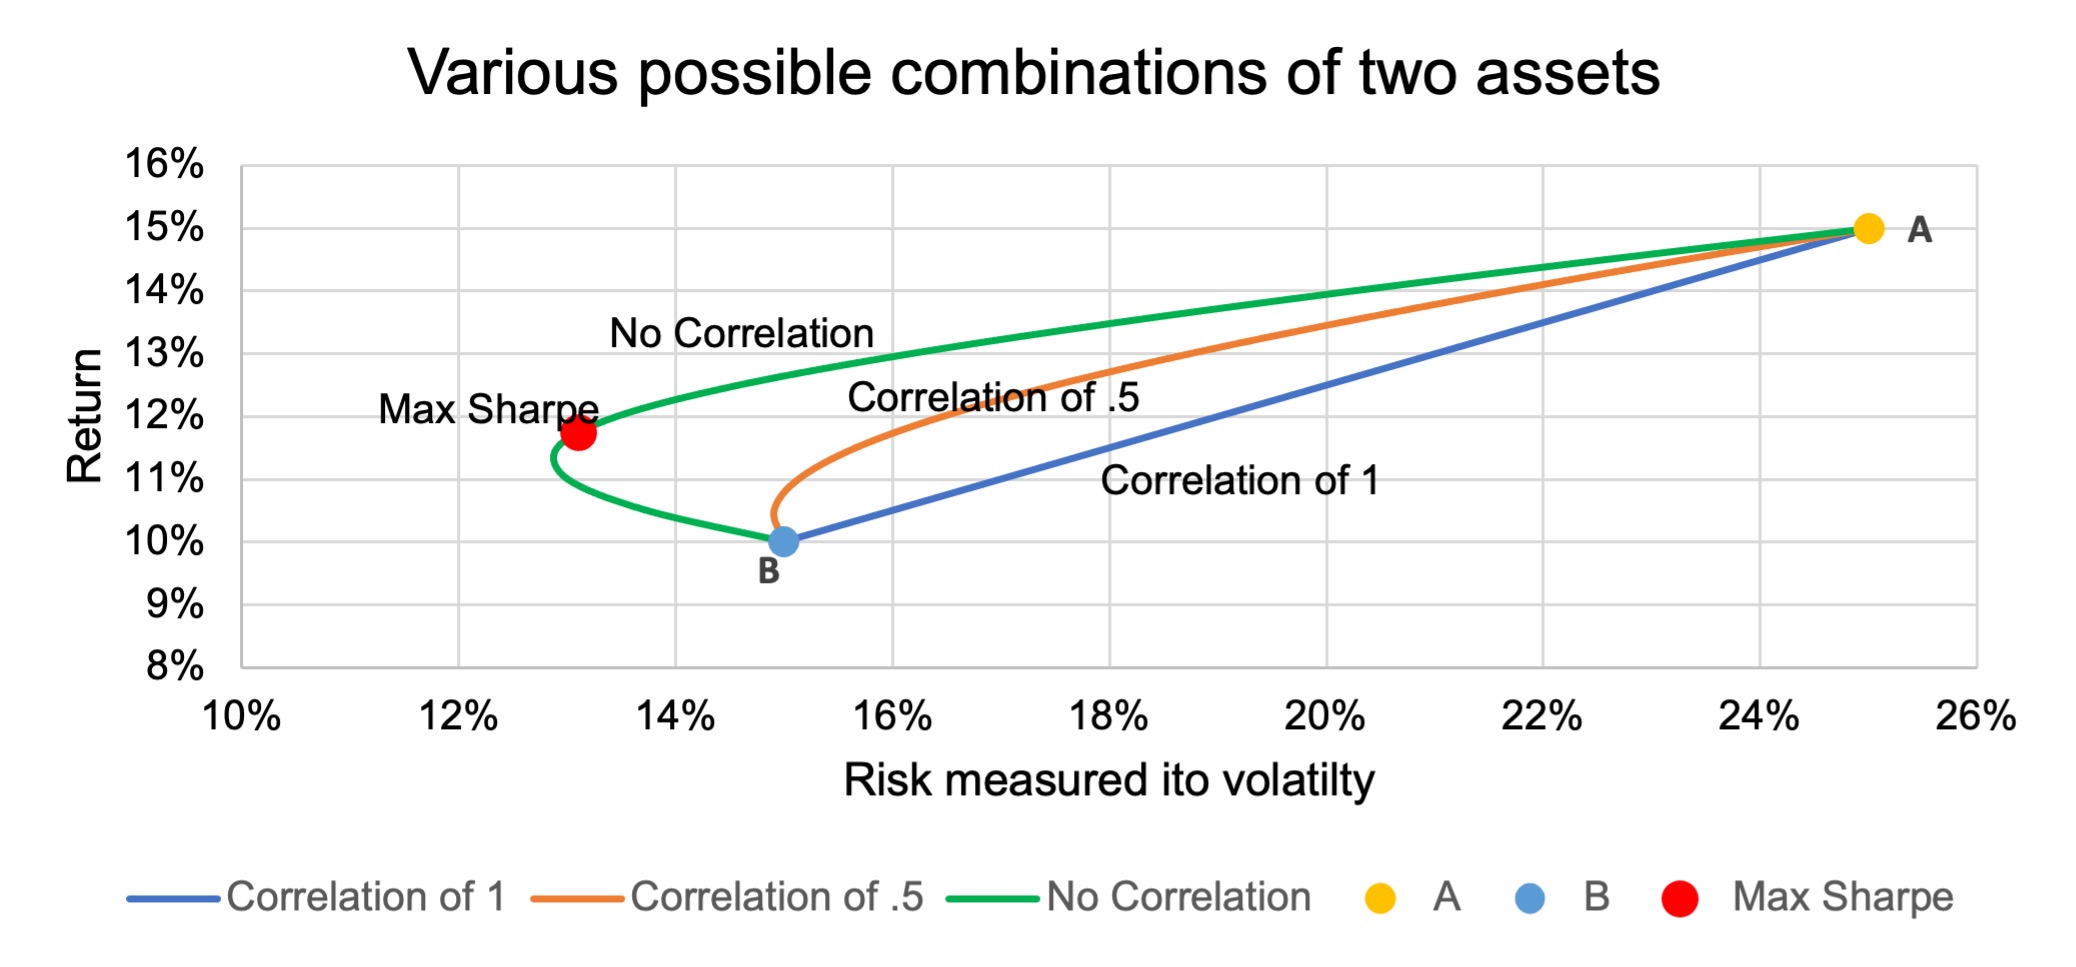
The blue line (scenario 1) shows all the possible portfolios that can be constructed using assets A and B if they are perfectly correlated. One can see that it is simply a linear combination (straight line) of the risk and return of asset A and B. There are no diversification benefits.
Similarly, the orange line (scenario 2) shows all the possible portfolios if the correlation is 0.5. One can see that this scenario offers some potential diversification benefits, as it is a curved line and not straight anymore.
The green line (scenario 3) represents the scenario where there is no correlation. Of the three scenarios, this one offers the greatest potential for diversification.
The main point from the graph above is that we can reduce our risk by having a combination of the two assets, if the correlation is not perfect. The potential for this reduction in risk increases as the correlation decreases.
In short, you should try to find investments with a low correlation between them when constructing a portfolio.
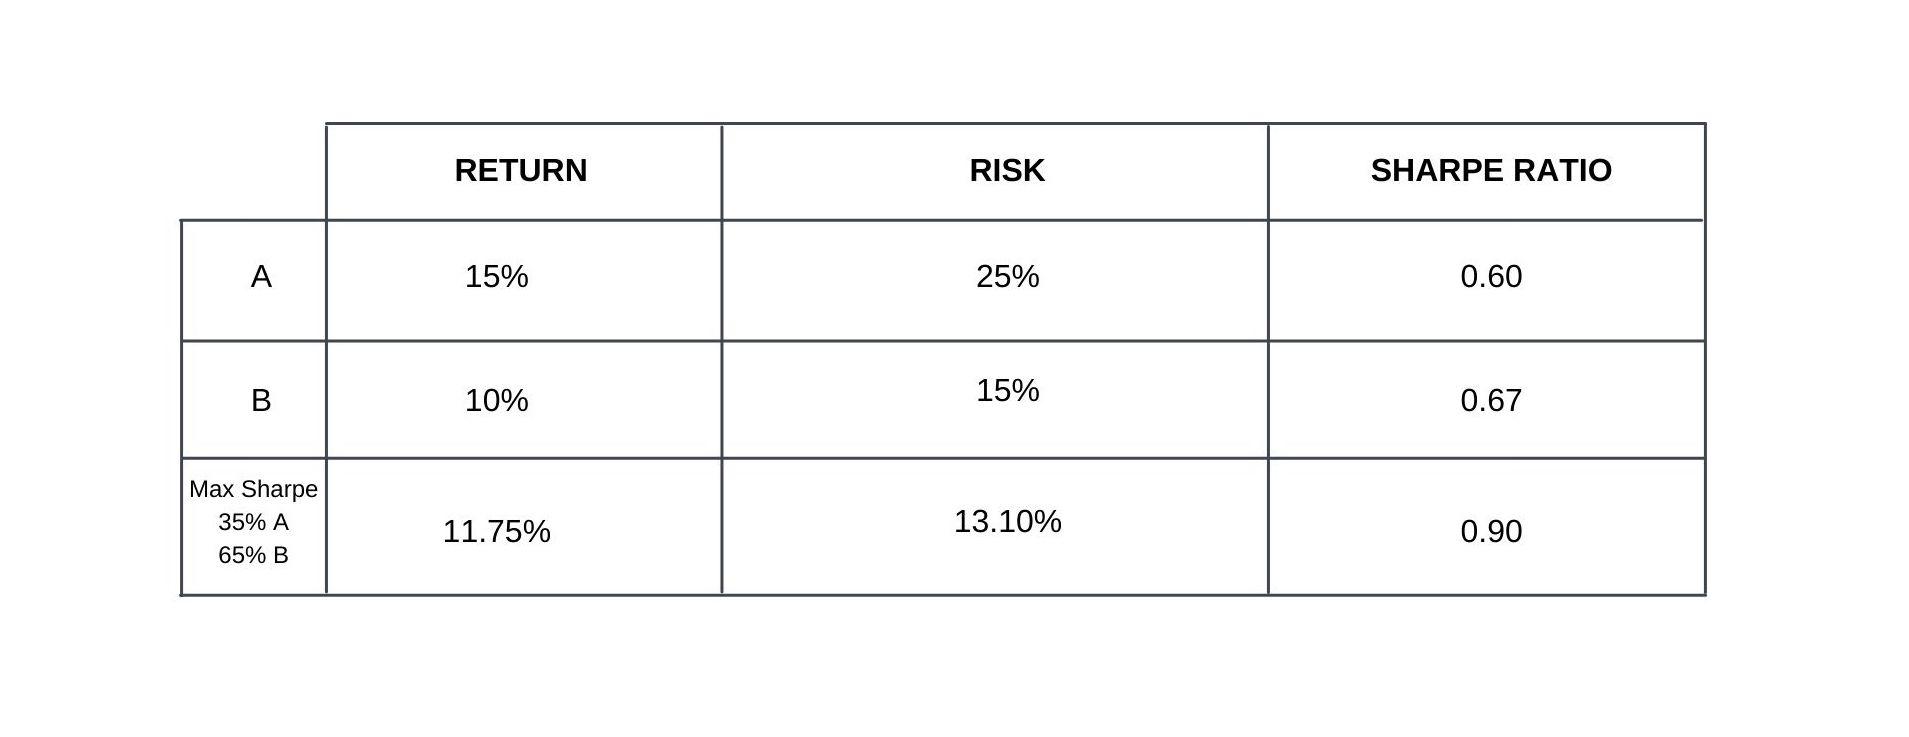
The red dot (Max Sharpe) on the graph is of special importance as it represents the point on the curve with no correlation, where the ratio of return relative to risk is at its highest.
The table below shows the expected return, risk and Sharpe ratio of the Maximum Sharpe ratio portfolio. Armed with this knowledge, we can evaluate the potential role of alternative investments in a portfolio.
Alternative investments in a portfolio
Traditionally, investors view stocks and bonds as the building blocks of a portfolio. Two asset classes are not that much. Furthermore, correlations are, unfortunately, typically high between these asset classes, generating very little diversification benefit.
One of the main features of alternative investments is that they offer very low and, in some cases, even negative correlation with the main asset classes.
Private equity or venture capital, hedge funds, real property, commodities, and tangible assets are all examples of alternative investments.
So, using our previous example, we will assume that we decided to invest in the Maximum Sharpe Ratio portfolio. Additionally, we identified an alternative investment with no correlation to our portfolio. But, the alternative asset in the example is deliberately chosen to have a lower return and higher risk than our combined portfolio consisting of assets A and B.
Here is a summary of our example:

So, what would we expect the outcome to be? Intuitively, one could argue that the return should go down, and the risk should increase. Let’s investigate this scenario further.
If we want to be conservative and only allocate 10% of the portfolio to this alternative investment, we can evaluate the impact graphically below.
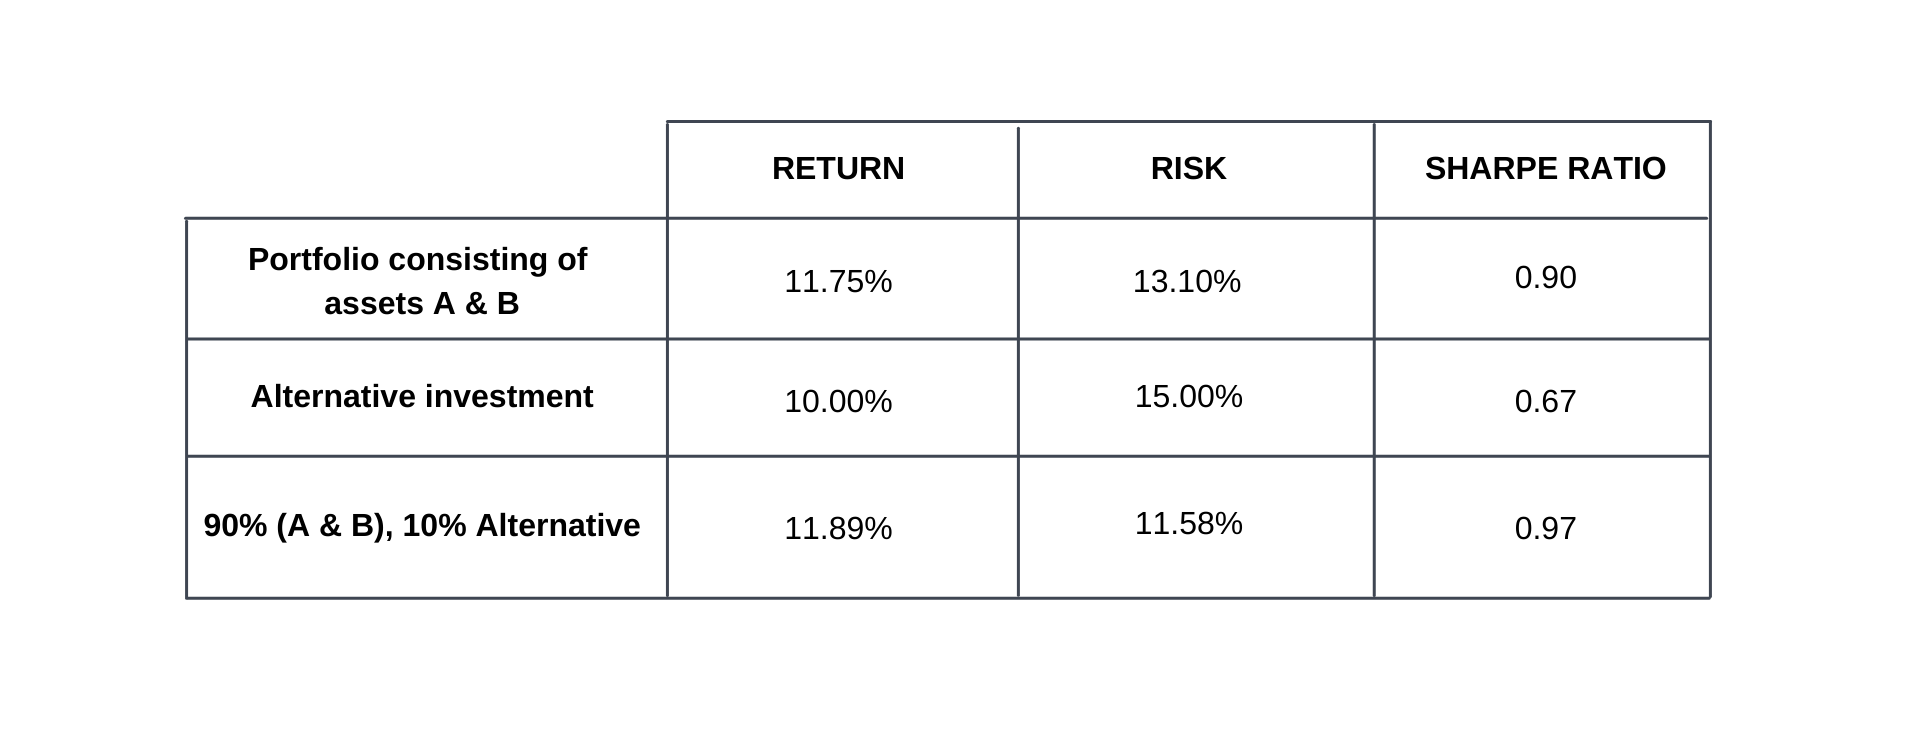
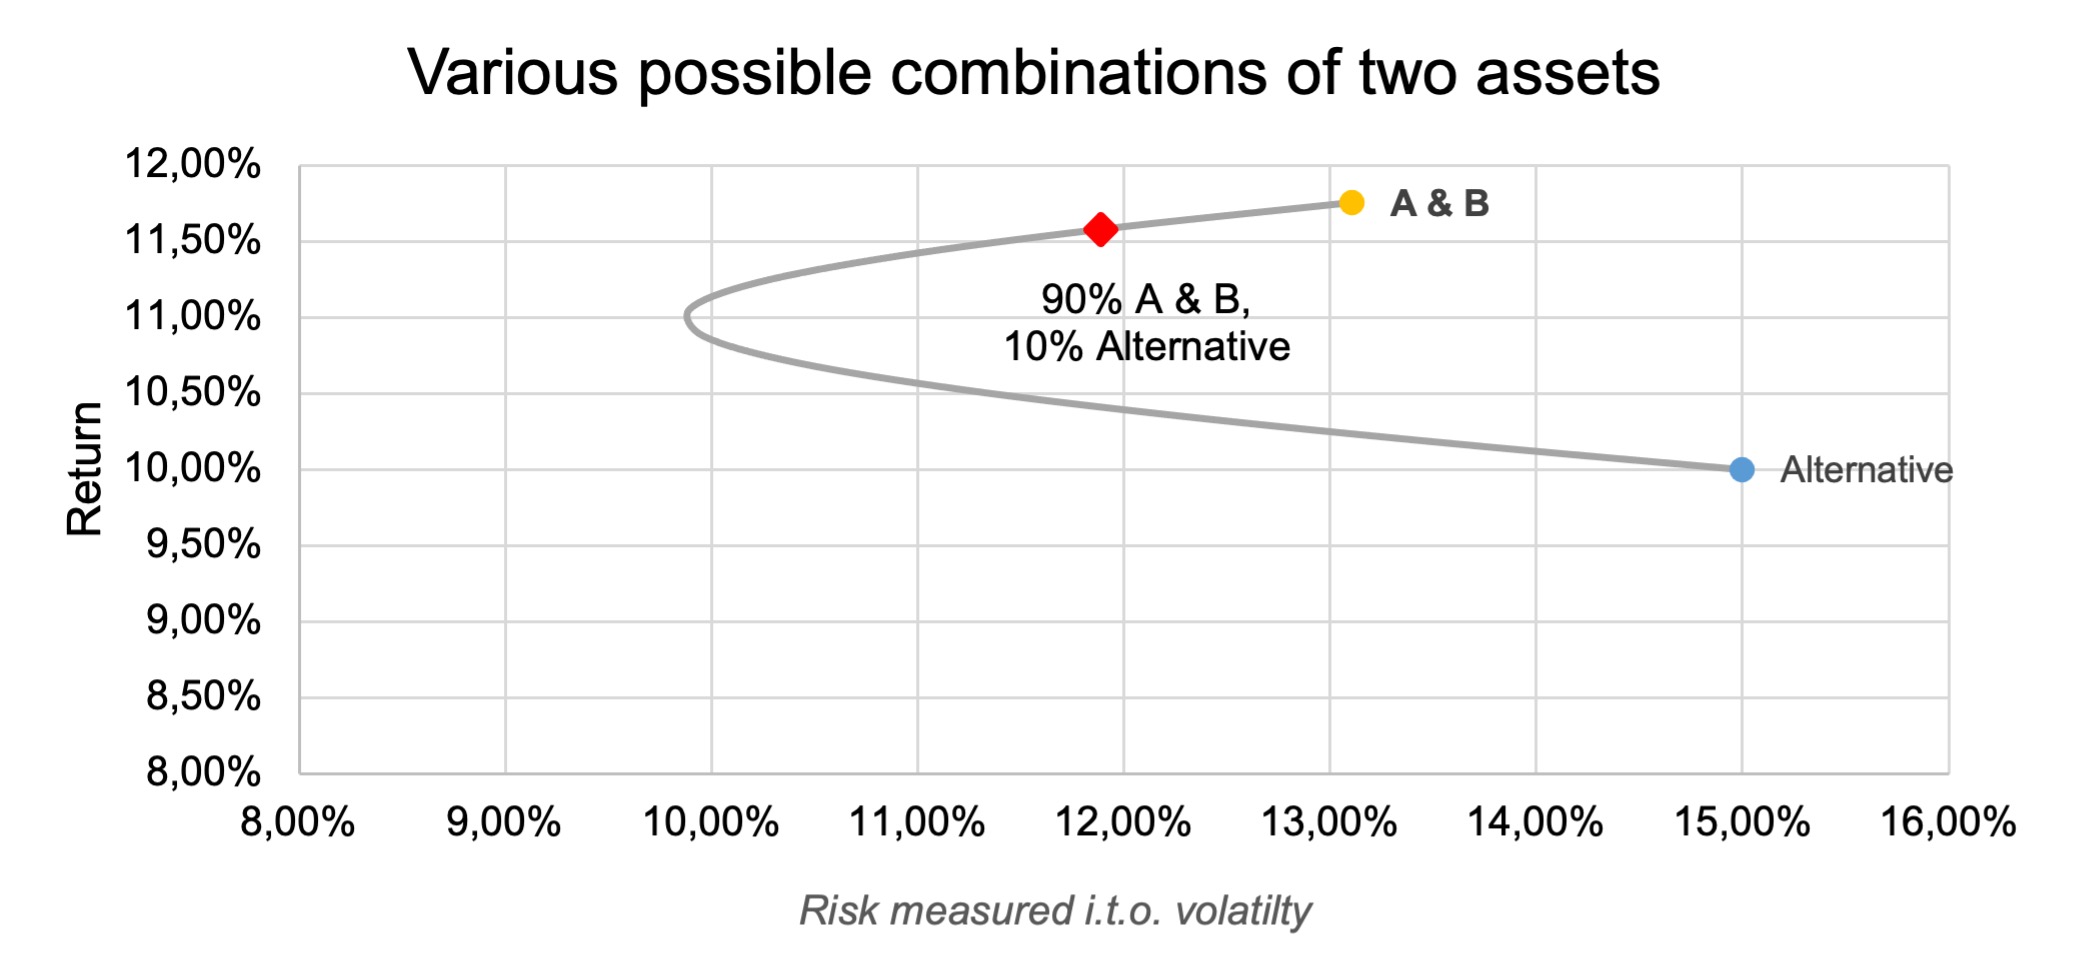
The red dot represents the outcome. The net result is that, while the expected return decreased marginally by 0,18% (18 basis points), the expected risk actually decreased substantially by 1,22% (122 basis points), improving the risk-return ratio by almost 9%.
ABOUT THE AUTHOR:
Henk Myburgh, CFA®- Head of Research
After completing a BCom Econometrics and MSc in Quantitative Risk Management at the North-West University, Henk Myburgh (CFA), started his career in financial risk management at HSBC. He also worked at Sanlam Capital Markets, where his focus was on consolidation of financial risk across the firm and management of risk on a holistic basis. In 2018 he founded AlQuaTra, a quantitative private hedge fund.


