“Due to its properties of being physically strong, lustrous, soft, flexible and malleable; silver has had many uses over the years. Silver is also a conductor of heat, without being chemically active – this makes it a great candidate for industrial uses. Silver is sensitive to light and contains anti-bacterial qualities.”
Supply
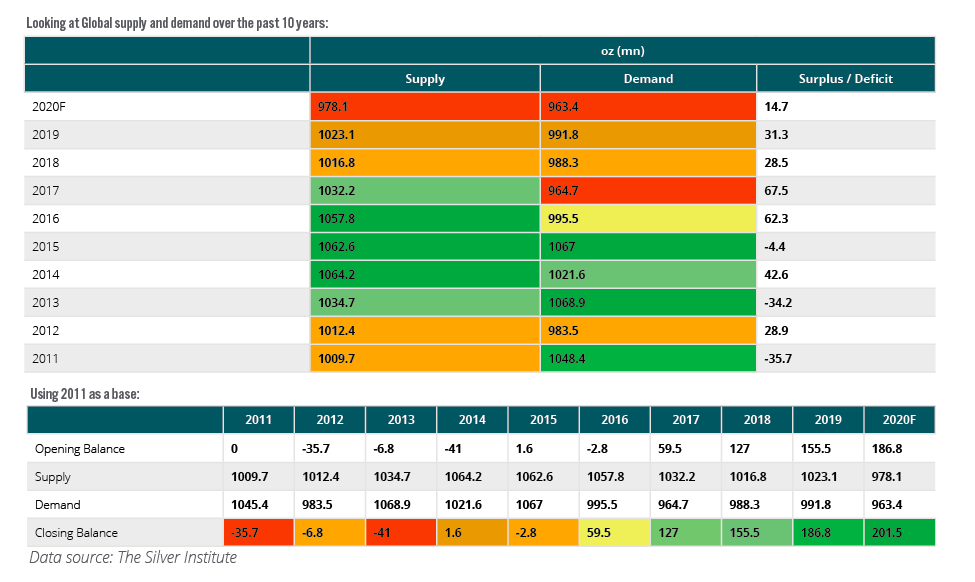
Although silver mines do exist, the majority (75%) of the commodity is obtained through the mining of lead and zinc (of which it is a by-product). Global production was down 1.3% last year. Declines in Peru, Mexico (the leading silver producer) and Indonesia were partially offset by gains in Argentina, Australia and the US.
Global physical demand increased 3.5% in 2019. The largest consumers of silver for industrial purposes were the US, Canada, China, India, Japan, South Korea, Germany and Russia. India and China have historically contributed to the demand for the commodity in the form of jewellery and silverware, but both of these were down last year – 1% and 9% respectively. Demand was negatively impacted by the US/China trade war, but new demand was seen in technological uses. Demand for physical silver increased (through bars and coins) by 12% last year – perhaps due to its affordability when compared to gold.

Demand
Historically, silver has been used in the below industries:
1. Industrial Fabrication (Solar panels/photovoltaics, automotive industry, brazing and soldering)
2. Domestic (Jewellery, cutlery, mirrors)
3. Physical (Bars, coins)
4.Photography (Consumer, graphic arts, radiography)
5. Medical
The past decade has seen a move away from photography (historically the number 1 end-user of the commodity) and towards technological uses, such as: vehicle electrification; photovoltaics (7% increase in 2019 demand); and brazing alloys (1% increase in 2019 demand). Demand in these areas is expected to continue to grow. Solder and brazing alloys, batteries, dentistry, glass coatings, LED chips, medicine, nuclear reactors, photography, photovoltaic (or solar) energy, RFID chips (for tracking parcels or shipments worldwide), semiconductors, touch screens, water purification, and wood preservatives all use silver. Technological advances have however allowed for altered processes (at a lower cost) so that manufacturers require less silver.
What about substitutes?
Due to silver’s unique elemental properties, direct substitution is impossible. Since 2011 there has been talk of Multilayer Graphene surfacing as a substitute for electrical and thermal conductivity, but still, no further progress in replacing silver as its manufacturing is relatively more costly. Conductive polymers pose another threat to silver. Despite these advancements, silver as an element is difficult to replicate and there is still no exact substitute that matches all of its properties. It is more likely that technological developments result in less silver being required to perform a task than no silver at all. This is what we have seen within photovoltaics since 2010. The quantity of silver needed within solar cells has declined by approximately 80%. Demand for silver has thus fallen within the photovoltaic industry, despite the increase in total solar panel production.
Photovoltaics – conversion of light into electricity using semiconducting materials that exhibit the photovoltaic effect (used in solar panels)
Comparisons
In a comparison of the returns from 1970 to date, it is evident that silver follows a similar pattern to other commodities, but exhibits far more volatility. If we compare silver and gold over the same period, we see the magnitude of this variability.
Perhaps this is due to the affordability of silver in comparison to gold, others have attributed it to silver market’s size in comparison to other commodity classes allowing for more volatile price movements.
What happened in 1980 and 2010?
1970-1980: Silver rose 3 105% from its 1970 low to 1980 high. There are a couple of theories around silver’s rise in 1970. The first is the theory of the Hunt brothers and their excessive purchasing of the commodity as an inflation hedge. W. Herbert Hunt and Nelson Bunker Hunt started purchasing large quantities of the commodity in 1979 (through the physical, as well as futures contracts), supposedly to try and corner the market. At their peak, they controlled about 250 million ounces of silver – 100 million in physical and 150 million in futures contracts. This was believed to be over half of the global privately owned supply. COMEX became aware of the market cornering and raised margin requirements, as well as placed limits on the number of futures contracts one could hold in an attempt to counter it. As a result, the Hunt brothers were forced to sell and prices fell with the increased supply in the market.
Some have said the data of the time did not include all silver available and that it was an overestimation of what was available. In this theory, the brothers controlled less than 10% of global supply (some say closer to 2%). Over the period, all commodities rose and fell. The correlation between the gold and silver price movement over that period was 99.2%. Platinum rose 180% in 1979 to its 1980 high; palladium rose 460%; and oil rose 300%. On top of that, they all peaked on almost the same day as silver. Other aspects which are believed to have impacted the increase in silver prices at the time are: economic recession; inflation at 13%, interest rates > 20%, high unemployment, 40% decline in the stock market, oil shortages and embargoes, ongoing cold war tensions, the Russian invasion of Afghanistan, US dollar weakness and the decline in industrial demand for silver whilst global supply increased.
2010: Similar to the 1970s/80s, there was fear around inflation climbing as the Fed and other central banks instituted quantitative easing (QE) programs. Investors purchased silver (and gold) in response to those fears. This increase in silver is largely attributable to inflation fears, and uncertainty resulting from the GFC.
In addition to these fears, supply and demand played a role. Photovoltaic use first made an impact on silver demand in 2000, just as photographic use began its decline. By 2008 government subsidies were introduced to promote the industry’s growth, leading to the consumption of 19 oz (mn) of silver within the photovoltaic sector. The demand for silver within the photovoltaics industry grew at an annual rate of 50% on the back of these subsidies.
In 2011, the GFC hit, these subsidies were cut and silver prices doubled and silver industrial demand declined as a result. Higher prices led to newer technology allowing for the same processes to be done, but with less silver.
The relationship between gold and silver
The above graph plots units of silver per unit of gold. Gold and silver typically trade within a range of 20 to 70 ounces of silver to the price of one ounce of gold. Traders often use this ratio as a gauge to decide when it is best to move from gold to silver (1:70) or from silver to gold (1:20). Based on this – we are well overdue for some silver purchasing.
Silver since the writing of this article:
Since deciding to include Silver within our model portfolios the commodity is up 26.86% (above), whilst Gold is up 4.71% (below). The ratio of units of silver per unit of gold has gone from 100.12 to 82.64 – still more than one standard deviation from the mean ratio
ABOUT THE AUTHOR:
Ashley Pedlar, CFA® – COO
Ashley obtained her MCom in Investment Management at the University of Johannesburg and is also a CFA charterholder. She was selected to participate in the CFA Equity Research project in 2015/16. Her team’s success in the local leg took them to Chicago in 2016, where they placed in the top 6 of the EMEA region. During her time at Sasfin Wealth she was a regular feature on the ‘Biweekly Friday midday market crossing’ on SAFM.


